Introduction
Welcome to the nearcore development guide!
The target audience of this guide is developers of nearcore itself. If you are a user of NEAR (either a contract developer, or validator running a node), please refer to the user docs at https://docs.near.org.
This guide is built with mdBook from sources in the nearcore repository. You can edit it by pressing the "edit" icon in the top right corner, we welcome all contributions. The guide is hosted at https://nomicon.io/.
The guide is organized as a collection of loosely coupled chapters -- you don't need to read them in order, feel free to peruse the TOC, and focus on the interesting bits. The chapters are classified into four parts:
- Protocol Specification includes the formal chain, network, and runtime specifications that define the NEAR Protocol blockchain.
- Architecture talks about how the code works. So, for example, if you are interested in how a transaction flows through the system, look there!
- Practices describe, broadly, how we write code. For example, if you want to learn about code style, issue tracking, or debugging performance problems, this is the chapter for you.
- Finally, the Misc part holds various assorted bits and pieces. We are trying to bias ourselves towards writing more docs, so, if you want to document something and it doesn't cleanly map to a category above, just put it in misc!
If you are unsure, start with Architecture Overview and then read Run a Node
Overview
This chapter describes various data structures used by NEAR Protocol.
Data Structures
Access Keys
Access key provides an access for a particular account. Each access key belongs to some account and
is identified by a unique (within the account) public key. Access keys are stored as account_id,public_key in a trie state. Account can have from zero to multiple access keys.
#![allow(unused)]
fn main() {
pub struct AccessKey {
    /// The nonce for this access key.
    /// NOTE: In some cases the access key needs to be recreated. If the new access key reuses the
    /// same public key, the nonce of the new access key should be equal to the nonce of the old
    /// access key. It's required to avoid replaying old transactions again.
    pub nonce: Nonce,
    /// Defines permissions for this access key.
    pub permission: AccessKeyPermission,
}
}
There are 2 types of AccessKeyPermission in NEAR currently: FullAccess and FunctionCall. FullAccess grants permissions to issue any action on the account. This includes DeployContract, Transfer tokens, call functions FunctionCall, Stake and even permission to delete the account DeleteAccountAction. FunctionCall on the other hand, only grants permission to call any or a specific set of methods on one given contract. It has an allowance of $NEAR that can be spent on GAS and transaction fees only. Function call access keys cannot be used to transfer $NEAR.
#![allow(unused)]
fn main() {
pub enum AccessKeyPermission {
    FunctionCall(FunctionCallPermission),
    FullAccess,
}
}
AccessKeyPermission::FunctionCall
Grants limited permission to make FunctionCall to a specified receiver_id and methods of a particular contract with a limit of allowed balance to spend.
#![allow(unused)]
fn main() {
pub struct FunctionCallPermission {
    /// Allowance is a balance limit to use by this access key to pay for function call gas and
    /// transaction fees. When this access key is used, both account balance and the allowance is
    /// decreased by the same value.
    /// `None` means unlimited allowance.
    /// NOTE: To change or increase the allowance, the old access key needs to be deleted and a new
    /// access key should be created.
    pub allowance: Option<Balance>,

    /// The access key only allows transactions with the given receiver's account id.
    pub receiver_id: AccountId,

    /// A list of method names that can be used. The access key only allows transactions with the
    /// function call of one of the given method names.
    /// Empty list means any method name can be used.
    pub method_names: Vec<String>,
}
}
Account without access keys
If account has no access keys attached it means that it has no owner who can run transactions from its behalf. However, if such accounts has code it can be invoked by other accounts and contracts.
Accounts
Account ID
NEAR Protocol has an account names system. Account ID is similar to a username. Account IDs have to follow the rules.
Account ID Rules
- minimum length is 2
- maximum length is 64
- Account ID consists of Account ID parts separated by
. - Account ID part consists of lowercase alphanumeric symbols separated by either
_or-. - Account ID that is 64 characters long and consists of lowercase hex characters is a specific NEAR-implicit account ID.
- Account ID that is
0xfollowed by 40 lowercase hex characters is a specific ETH-implicit account ID. - Account ID that is
0sfollowed by 40 lowercase hex characters is a specific NEAR-deterministic account ID.
Account names are similar to a domain names.
Top level account (TLA) like near, com, eth can only be created by registrar account (see next section for more details).
Only near can create alice.near. And only alice.near can create app.alice.near and so on.
Note, near can NOT create app.alice.near directly.
Additionally, there is an implicit account creation path.
Regex for a full account ID, without checking for length:
^(([a-z\d]+[\-_])*[a-z\d]+\.)*([a-z\d]+[\-_])*[a-z\d]+$
Top Level Accounts
| Name | Value |
|---|---|
| REGISTRAR_ACCOUNT_ID | registrar |
Top level account names (TLAs) are very valuable as they provide root of trust and discoverability for companies, applications and users. To allow for fair access to them, the top level account names are going to be auctioned off.
Specifically, only REGISTRAR_ACCOUNT_ID account can create new top level accounts (other than implicit accounts). REGISTRAR_ACCOUNT_ID implements standard Account Naming (link TODO) interface to allow create new accounts.
Note: we are not going to deploy registrar auction at launch, instead allow to deploy it by Foundation after initial launch. The link to details of the auction will be added here in the next spec release post MainNet.
Examples
Valid accounts:
ok
bowen
ek-2
ek.near
com
google.com
bowen.google.com
near
illia.cheap-accounts.near
max_99.near
100
near2019
over.9000
a.bro
// Valid, but can't be created, because "a" is too short
bro.a
Invalid accounts:
not ok           // Whitespace characters are not allowed
a                // Too short
100-             // Suffix separator
bo__wen          // Two separators in a row
_illia           // Prefix separator
.near            // Prefix dot separator
near.            // Suffix dot separator
a..near          // Two dot separators in a row
$$$              // Non alphanumeric characters are not allowed
WAT              // Non lowercase characters are not allowed
me@google.com    // @ is not allowed (it was allowed in the past)
system           // cannot use the system account, see the section on System account below
// TOO LONG:
abcdefghijklmnopqrstuvwxyz.abcdefghijklmnopqrstuvwxyz.abcdefghijklmnopqrstuvwxyz
System account
system is a special account that is only used to identify refund receipts. For refund receipts, we set the predecessor_id to be system to indicate that it is a refund receipt. Users cannot create or access the system account. In fact, this account does not exist as part of the state.
Implicit accounts
Implicit accounts work similarly to Bitcoin/Ethereum accounts. You can reserve an account ID before it's created by generating a corresponding (public, private) key pair locally. The public key maps to the account ID. The corresponding secret key allows you to use the account once it's created on chain.
NEAR-implicit account ID
The account ID is a lowercase hex representation of the public key. An ED25519 public key is 32 bytes long and maps to a 64-character account ID.
Example: a public key in base58 BGCCDDHfysuuVnaNVtEhhqeT4k9Muyem3Kpgq2U1m9HX will map to the account ID 98793cd91a3f870fb126f66285808c7e094afcfc4eda8a970f6648cdf0dbd6de.
ETH-implicit account ID
The account ID is derived from a Secp256K1 public key using the following formula: '0x' + keccak256(public_key)[12:32].hex().
Example: a public key in base58 2KFsZcvNUMBfmTp5DTMmguyeQyontXZ2CirPsb21GgPG3KMhwrkRuNiFCdMyRU3R4KbopMpSMXTFQfLoMkrg4HsT will map to the account ID 0x87b435f1fcb4519306f9b755e274107cc78ac4e3.
Implicit account creation
An account with implicit account ID can only be created by sending a transaction/receipt with a single Transfer action to the implicit account ID receiver:
- The account will be created with the account ID.
- The account balance will have a transfer balance deposited to it.
- If this is NEAR-implicit account, it will have a new full access key with the ED25519-curve public key of
decode_hex(account_id)and nonce(block_height - 1) * MULTIPLIER(to address an issues discussed here). - If this is ETH-implicit account, it will have the Wallet Contract deployed, which can only be used by the owner of the Secp256K1 private key where
'0x' + keccak256(public_key)[12:32].hex()matches the account ID.
Implicit account can not be created using CreateAccount action to avoid being able to hijack the account without having the corresponding private key.
Once a NEAR-implicit account is created it acts as a regular account until it's deleted.
An ETH-implicit account can only be used by calling the methods of the Wallet Contract. It cannot be deleted, nor can a full access key be added. The primary purpose of ETH-implicit accounts is to enable seamless integration of existing Ethereum tools (such as wallets) with the NEAR blockchain.
Wallet Contract
The Wallet Contract (see NEP-518 for more details) functions as a user account and is designed to receive, validate, and execute Ethereum-compatible transactions on the NEAR blockchain.
Without going into details, an Ethereum-compatible wallet user sends a transaction to an RPC endpoint, which wraps it and passes it to the Wallet Contract (on the target account) as an rlp_execute(target: AccountId, tx_bytes_b64: Vec<u8>) contract call.
Then, the contract parses tx_bytes_b64 and verifies it is signed with the private key matching the target ETH-implicit account ID on which the contract is hosted.
Under the hood, the transaction encodes a NEAR-native action. Currently supported actions are:
- Transfer (from ETH-implicit account).
- Function call (call another contract).
- Add
AccessKeywithFunctionCallPermission. This allows adding a relayer's public key to an ETH-implicit account, enabling the relayer to pay the gas fee for transactions from this account. Still, each transaction has to be signed by the owner of the account (corresponding Secp256K1 private key). - Delete
AccessKey.
Deterministic accounts
Deterministic accounts are an advanced kind of implicit account. A normal implicit account has a fixed access key that is implicitly associated with it. Deterministic accounts have a fixed code and fixed initial state associated with it.
State-initializing data of deterministic accounts
The initial state of a deterministic account is fully defined by an instance of DeterministicAccountStateInit.
Key-value pairs in data must be at most max_length_storage_key and max_length_storage_value bytes long,
respectively. These parameters are currently both set to 4Mib (4194304 bytes).
#![allow(unused)]
fn main() {
pub enum DeterministicAccountStateInit {
    V1(DeterministicAccountStateInitV1),
}

pub struct DeterministicAccountStateInitV1 {
    pub code: GlobalContractIdentifier,
    pub data: BTreeMap<Vec<u8>, Vec<u8>>,
}

pub enum GlobalContractIdentifier {
    CodeHash(CryptoHash) = 0,
    AccountId(AccountId) = 1,
}
}
Deterministic account ID
The account ID is derived from a DeterministicAccountStateInit instance.
To derive the deterministic account id, borsh-encode the DeterministicAccountStateInit enum instance into raw
bytes. Then use the following formula: '0s' + keccak256(bytes)[12:32].hex().
Deterministic account creation
Deterministic accounts cannot be created with a CreateAccount nor with a Transfer action.
A special action, DeterministicStateInitAction, is required.
This action validates that the account id matches its initial state.
As with all account types, you have to attach a large enough deposit to cover for the account storage. If the code and
initial state is small enough to fit below the zero-balance limit, no balance is required. The
DeterministicStateInitAction has a field to include a balance specifically to cover storage. Anything above the
required amount to cover storage requirements is refunded.
A Transfer can also deposit a balance before the DeterministicStateInitAction. The account will not be usable,
however, until the DeterministicStateInitAction is also executed.
After successful initialization, the account will have all key-value pairs in data: BTreeMap<Vec<u8>, Vec<u8>> in its
contract storage. The contract code will be set to that of the global contract defined with
code: GlobalContractIdentifier.
Account
Data for a single account is collocated in one shard. The account data consists of the following:
- Balance
- Locked balance (for staking)
- Code of the contract
- Key-value storage of the contract. Stored in a ordered trie
- Access Keys
- Postponed ActionReceipts
- Received DataReceipts
Balances
Total account balance consists of unlocked balance and locked balance.
Unlocked balance is tokens that the account can use for transaction fees, transfers staking and other operations.
Locked balance is the tokens that are currently in use for staking to be a validator or to become a validator. Locked balance may become unlocked at the beginning of an epoch. See Staking for details.
Contracts
A contract (AKA smart contract) is a program in WebAssembly that belongs to a specific account. When account is created, it doesn't have a contract (except ETH-implicit accounts). A contract has to be explicitly deployed, either by the account owner, or during the account creation. A contract can be executed by anyone who calls a method on your account. A contract has access to the storage on your account.
Storage
Every account has its own storage. It's a persistent key-value trie. Keys are ordered in lexicographical order. The storage can only be modified by the contract on the account. Current implementation on Runtime only allows your account's contract to read from the storage, but this might change in the future and other accounts's contracts will be able to read from your storage.
NOTE: Accounts must maintain a minimum amount of value at a rate of 1 NEAR per 100kb of total storage in order to remain responsive. This includes the storage of the account itself, contract code, contract storage, and all access keys. Any account with less than this minimum amount will not be able to maintain a responsive contract and will, instead, return an error related to this mismatch in storage vs. minimum account balance. See Storage Staking in the docs.
Access Keys
An access key grants an access to a account. Each access key on the account is identified by a unique public key. This public key is used to validate signature of transactions. Each access key contains a unique nonce to differentiate or order transactions signed with this access key.
An access key has a permission associated with it. The permission can be one of two types:
FullAccesspermission. It grants full access to the account.FunctionCallpermission. It grants access to only issued function call transactions.
See Access Keys for more details.
Block and Block Header
The data structures for block and block headers are
#![allow(unused)]
fn main() {
pub struct Block {
    /// Block Header
    pub header: BlockHeader,
    /// Headers of chunk in the block
    pub chunks: Vec<ShardChunkHeader>,
    /// Challenges, but they are not used today
    pub challenges: Challenges,

    /// Data to confirm the correctness of randomness beacon output
    pub vrf_value: [u8; 32],
    pub vrf_proof: [u8; 64],
}
}
#![allow(unused)]
fn main() {
pub struct BlockHeader {
    pub prev_hash: CryptoHash,

    /// Inner part of the block header that gets hashed, split into two parts, one that is sent
    ///    to light clients, and the rest
    pub inner_lite: BlockHeaderInnerLite,
    pub inner_rest: BlockHeaderInnerRest,

    /// Signature of the block producer.
    pub signature: Signature,

    /// Cached value of hash for this block.
    pub hash: CryptoHash,
}
}
where BlockHeaderInnerLite and BlockHeaderInnerRest are
#![allow(unused)]
fn main() {
pub struct BlockHeaderInnerLite {
    /// Height of this block.
    pub height: u64,
    /// Epoch start hash of this block's epoch.
    /// Used for retrieving validator information
    pub epoch_id: EpochId,
    pub next_epoch_id: EpochId,
    /// Root hash of the state at the previous block.
    pub prev_state_root: CryptoHash,
    /// Root of the outcomes of transactions and receipts.
    pub outcome_root: CryptoHash,
    /// Timestamp at which the block was built (number of non-leap-nanoseconds since January 1, 1970 0:00:00 UTC).
    pub timestamp: u64,
    /// Hash of the next epoch block producers set
    pub next_bp_hash: CryptoHash,
    /// Merkle root of block hashes up to the current block.
    pub block_merkle_root: CryptoHash,
}
}
#![allow(unused)]
fn main() {
pub struct BlockHeaderInnerRest {
    /// Root hash of the chunk receipts in the given block.
    pub chunk_receipts_root: CryptoHash,
    /// Root hash of the chunk headers in the given block.
    pub chunk_headers_root: CryptoHash,
    /// Root hash of the chunk transactions in the given block.
    pub chunk_tx_root: CryptoHash,
    /// Root hash of the challenges in the given block.
    pub challenges_root: CryptoHash,
    /// The output of the randomness beacon
    pub random_value: CryptoHash,
    /// Validator proposals.
    pub validator_proposals: Vec<ValidatorStake>,
    /// Mask for new chunks included in the block
    pub chunk_mask: Vec<bool>,
    /// Gas price. Same for all chunks
    pub gas_price: u128,
    /// Total supply of tokens in the system
    pub total_supply: u128,
    /// List of challenges result from previous block.
    pub challenges_result: ChallengesResult,

    /// Last block that has full BFT finality
    pub last_final_block: CryptoHash,
    /// Last block that has doomslug finality
    pub last_ds_final_block: CryptoHash,

    /// The ordinal of the Block on the Canonical Chain
    pub block_ordinal: u64,

    /// All the approvals included in this block
    pub approvals: Vec<Option<Signature>>,

    /// Latest protocol version that this block producer has.
    pub latest_protocol_version: u32,
}
}
Here CryptoHash is a 32-byte hash and EpochId is a 32-byte identifier.
Block Hash
The hash of a block is computed by
#![allow(unused)]
fn main() {
sha256(concat(
    sha256(concat(
        sha256(borsh(inner_lite)),
        sha256(borsh(inner_rest))
    )),
    prev_hash
))
}
Chunk and Chunk Header
The data structures for chunk and chunk header are
#![allow(unused)]
fn main() {
pub struct ShardChunkHeader {
    pub inner: ShardChunkHeaderInner,

    pub height_included: BlockHeight,

    /// Signature of the chunk producer.
    pub signature: Signature,

    pub hash: ChunkHash,
}
}
#![allow(unused)]
fn main() {
pub struct ShardChunk {
    pub chunk_hash: ChunkHash,
    pub header: ShardChunkHeader,
    pub transactions: Vec<SignedTransaction>,
    pub receipts: Vec<Receipt>,
}
}
where ShardChunkHeaderInner is
#![allow(unused)]
fn main() {
pub struct ShardChunkHeaderInner {
    /// Previous block hash.
    pub prev_block_hash: CryptoHash,
    pub prev_state_root: CryptoHash,
    /// Root of the outcomes from execution transactions and results.
    pub outcome_root: CryptoHash,
    pub encoded_merkle_root: CryptoHash,
    pub encoded_length: u64,
    pub height_created: u64,
    /// Shard index.
    pub shard_id: u64,
    /// Gas used in this chunk.
    pub gas_used: u64,
    /// Gas limit voted by validators.
    pub gas_limit: u64,
    /// Total balance burnt in previous chunk
    pub balance_burnt: u128,
    /// Outgoing receipts merkle root.
    pub outgoing_receipts_root: CryptoHash,
    /// Tx merkle root.
    pub tx_root: CryptoHash,
    /// Validator proposals.
    pub validator_proposals: Vec<ValidatorStake>,
}
}
Chunk Hash
Chunk hash is computed by
#![allow(unused)]
fn main() {
sha256(
    concat(
        sha256(borsh(inner)),
        encoded_merkle_root
    )
)
}
Data Types
type CryptoHash = [u8; 32]
A sha256 or keccak256 hash.
AccountId = String
Account identifier. Provides access to user's state.
type MerkleHash = CryptoHash
Hash used by a struct implementing the Merkle tree.
type ValidatorId = usize
Validator identifier in current group.
type ValidatorMask = [bool]
Mask which validators participated in multi sign.
type StorageUsage = u64
StorageUsage is used to count the amount of storage used by a contract.
type StorageUsageChange = i64
StorageUsageChange is used to count the storage usage within a single contract call.
type Nonce = u64
Nonce for transactions.
type BlockIndex = u64
Index of the block.
type ShardId = u64
Shard index, from 0 to NUM_SHARDS - 1.
type Balance = u128
Balance is type for storing amounts of tokens.
Gas = u64
Gas is a type for storing amount of gas.
Merkle Proofs
Many components of NEAR Protocol rely on Merkle root and Merkle proofs. For an array of sha256 hashes, we define its merkle root as:
CRYPTOHASH_DEFAULT = [0] * 32
def combine_hash(hash1, hash2):
    return sha256(hash1 + hash2)

def merkle_root(hashes):
    if len(hashes) == 0:
        return CRYPTOHASH_DEFAULT
    elif len(hashes) == 1:
        return hashes[0]
    else:
        l = hashes.len();
        subtree_len = l.next_power_of_two() // 2;
        left_root = merkle_root(hashes[0:subtree_len])
        right_root = merkle_root(hashes[subtree_len:l])
        return combine_hash(left_root, right_root)
Generally, for an array of borsh-serializable object, its merkle root is defined as
def arr_merkle_root(arr):
    return merkle_root(list(map(lambda x: sha256(borsh(x)), arr)))
A Merkle proof is defined by:
#![allow(unused)]
fn main() {
pub struct MerklePathItem {
    pub hash: MerkleHash,
    pub direction: Direction,
}

pub enum Direction {
    Left,
    Right,
}

pub type MerkleProof = Vec<MerklePathItem>;
}
The verification of a hash h against a proclaimed merkle root r with proof p is defined by:
def compute_root(h, p):
    res = h
    for item in p:
        if item.direction is Left:
            res = combine_hash(item.hash, res)
        else:
            res = combine_hash(res, item.hash)
    return res

assert compute_root(h, p) == r
Transaction
See Transactions documentation in the Runtime Specification section.
Overview
This chapter covers the NEAR Protocol chain specification.
Chain Specification
- Block Processing
- Consensus
- Light Client
- Selecting Chunk and Block Producers
- Transactions in the Blockchain Layer
- Upgradability
Block Processing
This section covers how blocks are processed once they arrive from the network.
Data Structures
Please refer to this section for details about blocks and chunks.
Validity of Block Header
A block header is invalid if any of the following holds:
timestampis invalid due to one of the following:- It is more than 120s ahead of the local time of the machine.
- It is smaller than the timestamp of the previous block.
- Its signature is not valid, i.e, verifying the signature using the public key of the block producer fails
epoch_idis invalid, i.e, it does not match the epoch id of the block computed locally.next_bp_hashis invalid. This could mean one of the following:epoch_id == prev_block.epoch_id && next_bp_hash != prev_block.next_bp_hashepoch_id != prev_block.epoch_id && next_bp_hash != compute_bp_hash(next_epoch_id, prev_hash)wherecompute_bp_hashcomputes the hash of next epoch's validators.
chunk_maskdoes not match the size of the chunk mask is not the same as the number of shards- Approval or finality information is invalid. See consensus for more details.
Validity of Block
A block is invalid if any of the following holds:
- Any of the chunk headers included in the block has an invalid signature.
- State root computed from chunk headers does not match
state_rootin the header. - Receipts root computed from chunk headers does not match
chunk_receipts_rootin the header. - Chunk headers root computed from chunk headers does not match
chunk_headers_rootin the header. - Transactions root computed from chunk headers does not match
chunk_tx_rootin the header. - For some index
i,chunk_mask[i]does not match whether a new chunk from shardiis included in the block. - Its vrf output is invalid
- Its gas price is invalid, i.e, gas priced computed from previous gas price and gas usage from chunks included in the block according to the formula described in economics does not match the gas price in the header.
- Its
validator_proposalsis not valid, which means that it does not match the concatenation of validator proposals from the chunk headers included in the block.
Process a new block
When a new block B is received from the network, the node first check whether it is ready to be processed:
- Its parent has already been processed.
- Header and the block itself are valid
- All the chunk parts are received. More specifically, this means
- For any shard that the node tracks, if there is a new chunk from that shard included in
B, the node has the entire chunk. - For block producers, they have their chunk parts for shards they do not track to guarantee data availability.
- For any shard that the node tracks, if there is a new chunk from that shard included in
Once all the checks are done, the chunks included in B can be applied.
If the chunks are successfully applied, B is saved and if the height of B is higher than the highest known block (head of the chain),
the head is updated.
Apply a chunk
In order to apply a chunk, we first check that the chunk is valid:
def validate_chunk(chunk):
    # get the local result of applying the previous chunk (chunk_extra)
    prev_chunk_extra = get_chunk_extra(chunk.prev_block_hash, chunk.shard_id)
    # check that the post state root of applying the previous chunk matches the prev state root in the current chunk
    assert prev_chunk_extra.state_root == chunk.state_root
    # check that the merkle root of execution outcomes match
    assert prev_chunk_extra.outcome_root == chunk.outcome_root
    # check that validator proposals match
    assert prev_chunk_extra.validator_proposals == chunk.validator_proposals
    # check that gas usage matches
    assert prev_chunk_extra.gas_used == chunk.gas_used
    # check that balance burnt matches
    assert prev_chunk_extra.balance_burnt == chunk.balance_burnt
    # check outgoing receipt root matches
    assert prev_chunk_extra.outgoing_receipt_root == chunk.outgoing_receipt_root
After this we apply transactions and receipts:
# get the incoming receipts for this shard
incoming_receipts = get_incoming_receipts(block_hash, shard_id)
# apply transactions and receipts and obtain the result, which includes state changes and execution outcomes
apply_result = apply_transactions(shard_id, state_root, chunk.transactions, incoming_receipts, other_block_info)
# save apply result locally
save_result(apply_result)
Catchup
If a node validates shard X in epoch T and needs to validate shard Y in epoch T+1 due to validator rotation, it has to download the state of that shard before epoch T+1 starts to be able to do so.
To accomplish this, the node will start downloading the state of shard Y at the beginning of epoch T and, after it has successfully downloaded the state, will apply all the chunks for shard Y in epoch T until the current block.
From there the node will apply chunks for both shard X and shard Y for the rest of the epoch.
Consensus
Definitions and notation
For the purpose of maintaining consensus, transactions are grouped into blocks. There is a single preconfigured block called genesis block. Every block except has a link pointing to the previous block , where is the block, and is reachable from every block by following those links (that is, there are no cycles).
The links between blocks give rise to a partial order: for blocks and , means that and is reachable from by following links to previous blocks, and means that or . The relations and are defined as the reflected versions of and , respectively. Finally, means that either , or , and means the opposite.
A chain is a set of blocks reachable from block , which is called its tip. That is, . For any blocks and , there is a chain that both and belong to iff . In this case, and are said to be on the same chain.
Each block has an integer height . It is guaranteed that block heights are monotonic (that is, for any block , ), but they need not be consecutive. Also, may not be zero. Each node keeps track of a valid block with the largest height it knows about, which is called its head.
Blocks are grouped into epochs. In a chain, the set of blocks that belongs to some epoch forms a contiguous range: if blocks and such that belong to the same epoch, then every block such that also belongs to that epoch. Epochs can be identified by sequential indices: belongs to an epoch with index , and for every other block , the index of its epoch is either the same as that of , or one greater.
Each epoch is associated with a set of block producers that are validating blocks in that epoch, as well as an assignment of block heights to block producers that are responsible for producing a block at that height. A block producer responsible for producing a block at height is called block proposer at . This information (the set and the assignment) for an epoch with index is determined by the last block of the epoch with index . For epochs with indices and , this information is preconfigured. Therefore, if two chains share the last block of some epoch, they will have the same set and the same assignment for the next two epochs, but not necessarily for any epoch after that.
The consensus protocol defines a notion of finality. Informally, if a block is final, any future final blocks may only be built on top of . Therefore, transactions in and preceding blocks are never going to be reversed. Finality is not a function of a block itself, rather, a block may be final or not final in some chain it is a member of. Specifically, , where , means that is final in . A block that is final in a chain is final in all of its extensions: specifically, if is true, then is also true for all .
Data structures
The fields in the Block header relevant to the consensus process are:
#![allow(unused)]
fn main() {
struct BlockHeader {
    ...
    prev_hash: BlockHash,
    height: BlockHeight,
    epoch_id: EpochId,
    last_final_block_hash: BlockHash,
    approvals: Vec<Option<Signature>>
    ...
}
}
Block producers in the particular epoch exchange many kinds of messages. The two kinds that are relevant to the consensus are Blocks and Approvals. The approval contains the following fields:
#![allow(unused)]
fn main() {
enum ApprovalInner {
    Endorsement(BlockHash),
    Skip(BlockHeight),
}

struct Approval {
    inner: ApprovalInner,
    target_height: BlockHeight,
    signature: Signature,
    account_id: AccountId
}
}
Where the parameter of the Endorsement is the hash of the approved block, the parameter of the Skip is the height of the approved block, target_height is the specific height at which the approval can be used (an approval with a particular target_height can be only included in the approvals of a block that has height = target_height), account_id is the account of the block producer who created the approval, and signature is their signature on the tuple (inner, target_height).
Approvals Requirements
Every block except the genesis block must logically contain approvals of a form described in the next paragraph from block producers whose cumulative stake exceeds of the total stake in the current epoch, and in specific conditions described in section epoch switches also the approvals of the same form from block producers whose cumulative stake exceeds of the total stake in the next epoch.
The approvals logically included in the block must be an Endorsement with the hash of if and only if , otherwise it must be a Skip with the height of . See this section below for details on why the endorsements must contain the hash of the previous block, and skips must contain the height.
Note that since each approval that is logically stored in the block is the same for each block producer (except for the account_id of the sender and the signature), it is redundant to store the full approvals. Instead physically we only store the signatures of the approvals. The specific way they are stored is the following: we first fetch the ordered set of block producers from the current epoch. If the block is on the epoch boundary and also needs to include approvals from the next epoch (see epoch switches), we add new accounts from the new epoch
def get_accounts_for_block_ordered(h, prev_block):
    cur_epoch = get_next_block_epoch(prev_block)
    next_epoch = get_next_block_next_epoch(prev_block)

    account_ids = get_epoch_block_producers_ordered(cur_epoch)
    if next_block_needs_approvals_from_next_epoch(prev_block):
        for account_id in get_epoch_block_producers_ordered(next_epoch):
            if account_id not in account_ids:
                account_ids.append(account_id)

    return account_ids
The block then contains a vector of optional signatures of the same or smaller size than the resulting set of account_ids, with each element being None if the approval for such account is absent, or the signature on the approval message if it is present. It's easy to show that the actual approvals that were signed by the block producers can easily be reconstructed from the information available in the block, and thus the signatures can be verified. If the vector of signatures is shorter than the length of account_ids, the remaining signatures are assumed to be None.
Messages
On receipt of the approval message the participant just stores it in the collection of approval messages.
def on_approval(self, approval):
    self.approvals.append(approval)
Whenever a participant receives a block, the operations relevant to the consensus include updating the head and initiating a timer to start sending the approvals on the block to the block producers at the consecutive target_heights. The timer delays depend on the height of the last final block, so that information is also persisted.
def on_block(self, block):
    header = block.header

    if header.height <= self.head_height:
        return

    last_final_block = store.get_block(header.last_final_block_hash)

    self.head_height = header.height
    self.head_hash = block.hash()
    self.largest_final_height = last_final_block.height

    self.timer_height = self.head_height + 1
    self.timer_started = time.time()

    self.endorsement_pending = True
The timer needs to be checked periodically, and contain the following logic:
def get_delay(n):
    min(MAX_DELAY, MIN_DELAY + DELAY_STEP * (n-2))

def process_timer(self):
    now = time.time()

    skip_delay = get_delay(self.timer_height - self.largest_final_height)

    if self.endorsement_pending and now > self.timer_started + ENDORSEMENT_DELAY:

        if self.head_height >= self.largest_target_height:
            self.largest_target_height = self.head_height + 1
            self.send_approval(head_height + 1)

        self.endorsement_pending = False

    if now > self.timer_started + skip_delay:
        assert not self.endorsement_pending

        self.largest_target_height = max(self.largest_target_height, self.timer_height + 1)
        self.send_approval(self.timer_height + 1)

        self.timer_started = now
        self.timer_height += 1

def send_approval(self, target_height):
    if target_height == self.head_height + 1:
        inner = Endorsement(self.head_hash)
    else:
        inner = Skip(self.head_height)

    approval = Approval(inner, target_height)
    send(approval, to_whom = get_block_proposer(self.head_hash, target_height))
Where get_block_proposer returns the next block proposer given the previous block and the height of the next block.
It is also necessary that ENDORSEMENT_DELAY < MIN_DELAY. Moreover, while not necessary for correctness, we require that ENDORSEMENT_DELAY * 2 <= MIN_DELAY.
Block Production
We first define a convenience function to fetch approvals that can be included in a block at particular height:
def get_approvals(self, target_height):
    return [approval for approval
                     in self.approvals
                     if approval.target_height == target_height and
                        (isinstance(approval.inner, Skip) and approval.prev_height == self.head_height or
                         isinstance(approval.inner, Endorsement) and approval.prev_hash == self.head_hash)]
A block producer assigned for a particular height produces a block at that height whenever they have get_approvals return approvals from block producers whose stake collectively exceeds 2/3 of the total stake.
Finality condition
A block is final in , where , when either or there is a block such that and . That is, either is the genesis block, or includes at least two blocks on top of , and these three blocks ( and the two following blocks) have consecutive heights.
Epoch switches
There's a parameter that defines the minimum length of an epoch. Suppose that a particular epoch started at height , and say the next epoch will be . Say is a set of block producers in epoch . Say is the highest final block in . The following are the rules of what blocks contain approvals from what block producers, and belong to what epoch.
- Any block with is in the epoch and must have approvals from more than of (stake-weighted).
- Any block with for which is in the epoch and must logically include approvals from both more than of and more than of (both stake-weighted).
- The first block with is in the epoch and must logically include approvals from more than of (stake-weighted).
(see the definition of logically including approvals in approval requirements)
Safety
Note that with the implementation above a honest block producer can never produce two endorsements with the same prev_height (call this condition conflicting endorsements), neither can they produce a skip message s and an endorsement e such that s.prev_height < e.prev_height and s.target_height >= e.target_height (call this condition conflicting skip and endorsement).
Theorem Suppose that there are blocks , , and such that , and . Then, more than of the block producer in some epoch must have signed either conflicting endorsements or conflicting skip and endorsement.
Proof Without loss of generality, we can assume that these blocks are chosen such that their heights are smallest possible. Specifically, we can assume that and . Also, letting be the highest block that is an ancestor of both and , we can assume that there is no block such that and or and .
Lemma There is such an epoch that all blocks such that or include approvals from more than of the block producers in .
Proof There are two cases.
Case 1: Blocks , and are all in the same epoch. Because the set of blocks in a given epoch in a given chain is a contiguous range, all blocks between them (specifically, all blocks such that or ) are also in the same epoch, so all those blocks include approvals from more than of the block producers in that epoch.
Case 2: Blocks , and are not all in the same epoch. Suppose that and are in different epochs. Let be the epoch of and be the preceding epoch ( cannot be in the same epoch as the genesis block). Let and be the first and the last block of in . Then, there must exist a block in epoch such that . Because , we have , and since there are no final blocks such that , we conclude that . Because there are no epochs between and , we conclude that is in epoch . Also, . Thus, any block after and until the end of must include approvals from more than of the block producers in . Applying the same argument to , we can determine that is either in or , and in both cases all blocks such that include approvals from more than of block producers in (the set of block producers in is the same in and because the last block of the epoch preceding , if any, is before and thus is shared by both chains). The case where and are in the same epoch, but and are in different epochs is handled similarly. Thus, the lemma is proven.
Now back to the theorem. Without loss of generality, assume that . On the one hand, if doesn't include a block at height , then the first block at height greater than must include skips from more than of the block producers in which conflict with endorsements in , therefore, more than of the block producers in must have signed conflicting skip and endorsement. Similarly, if doesn't include a block at height , more than of the block producers in signed both an endorsement in and a skip in the first block in at height greater than . On the other hand, if includes both a block at height and a block at height , the latter must include endorsements for the former, which conflict with endorsements for . Therefore, more than of the block producers in must have signed conflicting endorsements. Thus, the theorem is proven.
Liveness
See the proof of liveness in Doomslug Whitepaper and the recent Nightshade sharding protocol.
The consensus in this section differs in that it requires two consecutive blocks with endorsements. The proof in the linked paper trivially extends, by observing that once the delay is sufficiently long for a honest block producer to collect enough endorsements, the next block producer ought to have enough time to collect all the endorsements too.
Approval condition
The approval condition above
Any valid block must logically include approvals from block producers whose cumulative stake exceeds of the total stake in the epoch. For a block and its previous block each approval in must be an
Endorsementwith the hash of if and only ifB.height == B'.height + 1, otherwise it must be aSkipwith the height of .
Is more complex that desired, and it is tempting to unify the two conditions. Unfortunately, they cannot be unified.
It is critical that for endorsements each approval has the prev_hash equal to the hash of the previous block, because otherwise the safety proof above doesn't work, in the second case the endorsements in and can be the very same approvals.
It is critical that for the skip messages we do not require the hashes in the approvals to match the hash of the previous block, because otherwise a malicious actor can create two blocks at the same height, and distribute them such that half of the block producers have one as their head, and the other half has the other. The two halves of the block producers will be sending skip messages with different prev_hash but the same prev_height to the future block producers, and if there's a requirement that the prev_hash in the skip matches exactly the prev_hash of the block, no block producer will be able to create their blocks.
Light Client
The state of the light client is defined by:
BlockHeaderInnerLiteViewfor the current head (which containsheight,epoch_id,next_epoch_id,prev_state_root,outcome_root,timestamp, the hash of the block producers set for the next epochnext_bp_hash, and the merkle root of all the block hashesblock_merkle_root);- The set of block producers for the current and next epochs.
The epoch_id refers to the epoch to which the block that is the current known head belongs, and next_epoch_id is the epoch that will follow.
Light clients operate by periodically fetching instances of LightClientBlockView via particular RPC end-point described below.
Light client doesn't need to receive LightClientBlockView for all the blocks. Having the LightClientBlockView for block B is sufficient to be able to verify any statement about state or outcomes in any block in the ancestry of B (including B itself). In particular, having the LightClientBlockView for the head is sufficient to locally verify any statement about state or outcomes in any block on the canonical chain.
However, to verify the validity of a particular LightClientBlockView, the light client must have verified a LightClientBlockView for at least one block in the preceding epoch, thus to sync to the head the light client will have to fetch and verify a LightClientBlockView per epoch passed.
Validating Light Client Block Views
#![allow(unused)]
fn main() {
pub enum ApprovalInner {
    Endorsement(CryptoHash),
    Skip(BlockHeight)
}

pub struct ValidatorStakeView {
    pub account_id: AccountId,
    pub public_key: PublicKey,
    pub stake: Balance,
}

pub struct BlockHeaderInnerLiteView {
    pub height: BlockHeight,
    pub epoch_id: CryptoHash,
    pub next_epoch_id: CryptoHash,
    pub prev_state_root: CryptoHash,
    pub outcome_root: CryptoHash,
    pub timestamp: u64,
    pub next_bp_hash: CryptoHash,
    pub block_merkle_root: CryptoHash,
}

pub struct LightClientBlockLiteView {
    pub prev_block_hash: CryptoHash,
    pub inner_rest_hash: CryptoHash,
    pub inner_lite: BlockHeaderInnerLiteView,
}


pub struct LightClientBlockView {
    pub prev_block_hash: CryptoHash,
    pub next_block_inner_hash: CryptoHash,
    pub inner_lite: BlockHeaderInnerLiteView,
    pub inner_rest_hash: CryptoHash,
    pub next_bps: Option<Vec<ValidatorStakeView>>,
    pub approvals_after_next: Vec<Option<Signature>>,
}
}
Recall that the hash of the block is
#![allow(unused)]
fn main() {
sha256(concat(
    sha256(concat(
        sha256(borsh(inner_lite)),
        sha256(borsh(inner_rest))
    )),
    prev_hash
))
}
The fields prev_block_hash, next_block_inner_hash and inner_rest_hash are used to reconstruct the hashes of the current and next block, and the approvals that will be signed, in the following way (where block_view is an instance of LightClientBlockView):
def reconstruct_light_client_block_view_fields(block_view):
    current_block_hash = sha256(concat(
        sha256(concat(
            sha256(borsh(block_view.inner_lite)),
            block_view.inner_rest_hash,
        )),
        block_view.prev_block_hash
    ))

    next_block_hash = sha256(concat(
        block_view.next_block_inner_hash,
        current_block_hash
    ))

    approval_message = concat(
        borsh(ApprovalInner::Endorsement(next_block_hash)),
        little_endian(block_view.inner_lite.height + 2)
    )

    return (current_block_hash, next_block_hash, approval_message)
The light client updates its head with the information from LightClientBlockView iff:
- The height of the block is higher than the height of the current head;
- The epoch of the block is equal to the
epoch_idornext_epoch_idknown for the current head; - If the epoch of the block is equal to the
next_epoch_idof the head, thennext_bpsis notNone; approvals_after_nextcontain valid signatures onapproval_messagefrom the block producers of the corresponding epoch (see next section);- The signatures present in
approvals_after_nextcorrespond to more than 2/3 of the total stake (see next section). - If
next_bpsis not none,sha256(borsh(next_bps))corresponds to thenext_bp_hashininner_lite.
def validate_and_update_head(block_view):
    global head
    global epoch_block_producers_map

    current_block_hash, next_block_hash, approval_message = reconstruct_light_client_block_view_fields(block_view)

    # (1)
    if block_view.inner_lite.height <= head.inner_lite.height:
        return False

    # (2)
    if block_view.inner_lite.epoch_id not in [head.inner_lite.epoch_id, head.inner_lite.next_epoch_id]:
        return False

    # (3)
    if block_view.inner_lite.epoch_id == head.inner_lite.next_epoch_id and block_view.next_bps is None:
        return False

    # (4) and (5)
    total_stake = 0
    approved_stake = 0

    epoch_block_producers = epoch_block_producers_map[block_view.inner_lite.epoch_id]
    for maybe_signature, block_producer in zip(block_view.approvals_after_next, epoch_block_producers):
        total_stake += block_producer.stake

        if maybe_signature is None:
            continue

        approved_stake += block_producer.stake
        if not verify_signature(
            public_key: block_producer.public_key,
            signature: maybe_signature,
            message: approval_message
        ):
            return False

    threshold = total_stake * 2 // 3
    if approved_stake <= threshold:
        return False

    # (6)
    if block_view.next_bps is not None:
        if sha256(borsh(block_view.next_bps)) != block_view.inner_lite.next_bp_hash:
            return False

        epoch_block_producers_map[block_view.inner_lite.next_epoch_id] = block_view.next_bps

    head = block_view
Signature verification
To simplify the protocol we require that the next block and the block after next are both in the same epoch as the block that LightClientBlockView corresponds to. It is guaranteed that each epoch has at least one final block for which the next two blocks that build on top of it are in the same epoch.
By construction by the time the LightClientBlockView is being validated, the block producers set for its epoch is known. Specifically, when the first light client block view of the previous epoch was processed, due to (3) above the next_bps was not None, and due to (6) above it was corresponding to the next_bp_hash in the block header.
The sum of all the stakes of next_bps in the previous epoch is total_stake referred to in (5) above.
The signatures in the LightClientBlockView::approvals_after_next are signatures on approval_message. The i-th signature in approvals_after_next, if present, must validate against the i-th public key in next_bps from the previous epoch. approvals_after_next can contain fewer elements than next_bps in the previous epoch.
approvals_after_next can also contain more signatures than the length of next_bps in the previous epoch. This is due to the fact that, as per consensus specification, the last blocks in each epoch contain signatures from both the block producers of the current epoch, and the next epoch. The trailing signatures can be safely ignored by the light client implementation.
Proof Verification
Transaction Outcome Proofs
To verify that a transaction or receipt happens on chain, a light client can request a proof through rpc by providing id, which is of type
#![allow(unused)]
fn main() {
pub enum TransactionOrReceiptId {
    Transaction { hash: CryptoHash, sender: AccountId },
    Receipt { id: CryptoHash, receiver: AccountId },
}
}
and the block hash of light client head. The rpc will return the following struct
#![allow(unused)]
fn main() {
pub struct RpcLightClientExecutionProofResponse {
    /// Proof of execution outcome
    pub outcome_proof: ExecutionOutcomeWithIdView,
    /// Proof of shard execution outcome root
    pub outcome_root_proof: MerklePath,
    /// A light weight representation of block that contains the outcome root
    pub block_header_lite: LightClientBlockLiteView,
    /// Proof of the existence of the block in the block merkle tree,
    /// which consists of blocks up to the light client head
    pub block_proof: MerklePath,
}
}
which includes everything that a light client needs to prove the execution outcome of the given transaction or receipt.
Here ExecutionOutcomeWithIdView is
#![allow(unused)]
fn main() {
pub struct ExecutionOutcomeWithIdView {
    /// Proof of the execution outcome
    pub proof: MerklePath,
    /// Block hash of the block that contains the outcome root
    pub block_hash: CryptoHash,
    /// Id of the execution (transaction or receipt)
    pub id: CryptoHash,
    /// The actual outcome
    pub outcome: ExecutionOutcomeView,
}
}
The proof verification can be broken down into two steps, execution outcome root verification and block merkle root verification.
Execution Outcome Root Verification
If the outcome root of the transaction or receipt is included in block H, then outcome_proof includes the block hash
of H, as well as the merkle proof of the execution outcome in its given shard. The outcome root in H can be
reconstructed by
shard_outcome_root = compute_root(sha256(borsh(execution_outcome)), outcome_proof.proof)
block_outcome_root = compute_root(sha256(borsh(shard_outcome_root)), outcome_root_proof)
This outcome root must match the outcome root in block_header_lite.inner_lite.
Block Merkle Root Verification
Recall that block hash can be computed from LightClientBlockLiteView by
#![allow(unused)]
fn main() {
sha256(concat(
    sha256(concat(
        sha256(borsh(inner_lite)),
        sha256(borsh(inner_rest))
    )),
    prev_hash
))
}
The expected block merkle root can be computed by
block_hash = compute_block_hash(block_header_lite)
block_merkle_root = compute_root(block_hash, block_proof)
which must match the block merkle root in the light client block of the light client head.
RPC end-points
Light Client Block
There's a single end-point that full nodes exposed that light clients can use to fetch new LightClientBlockViews:
http post http://127.0.0.1:3030/ jsonrpc=2.0 method=next_light_client_block params:="[<last known hash>]" id="dontcare"
The RPC returns the LightClientBlock for the block as far into the future from the last known hash as possible for the light client to still accept it. Specifically, it either returns the last final block of the next epoch, or the last final known block. If there's no newer final block than the one the light client knows about, the RPC returns an empty result.
A standalone light client would bootstrap by requesting next blocks until it receives an empty result, and then periodically request the next light client block.
A smart contract-based light client that enables a bridge to NEAR on a different blockchain naturally cannot request blocks itself. Instead external oracles query the next light client block from one of the full nodes, and submit it to the light client smart contract. The smart contract-based light client performs the same checks described above, so the oracle doesn't need to be trusted.
Light Client Proof
The following rpc end-point returns RpcLightClientExecutionProofResponse that a light client needs for verifying execution outcomes.
For transaction execution outcome, the rpc is
http post http://127.0.0.1:3030/ jsonrpc=2.0 method=EXPERIMENTAL_light_client_proof params:="{"type": "transaction", "transaction_hash": <transaction_hash>, "sender_id": <sender_id>, "light_client_head": <light_client_head>}" id="dontcare"
For receipt execution outcome, the rpc is
http post http://127.0.0.1:3030/ jsonrpc=2.0 method=EXPERIMENTAL_light_client_proof params:="{"type": "receipt", "receipt_id": <receipt_id>, "receiver_id": <receiver_id>, "light_client_head": <light_client_head>}" id="dontcare"
Selecting Chunk and Block Producers
Background
Near is intended to be a sharded blockchain. At the time of writing (March 2021), challenges (an important security feature for a sharded network) are not fully implemented. As a stepping stone towards the full sharded solution, Near will go through a phase called "Simple Nightshade". In this protocol, block producers will track all shards (i.e. validate all transactions, eliminating the need for challenges), and there will be an additional type of participant called a "chunk-only producer" which tracks only a single shard. A block includes one chunk for each shard, and it is the chunks which include the transactions that were executed for its associated shard. The purpose of this design is to allow decentralization (running a node which supports a chunk-only producer should be possible for a large number of participants) while maintaining security (since block producers track all shards). For more details on chunks see the subsequent chapter on Transactions. Note: the purpose of the "chunk-only" nomenclature is to reduce confusion since block producers will also produce chunks some times (they track all shards, so they will be able to produce chunks for any shard easily); thus the key distinction is that chunk-only producers only produce chunks, i.e. never produce blocks.
Near is a permission-less blockchain, so anyone (with sufficient stake) can become a chunk-only producer, or a block producer. In this section we outline the algorithm by which chunk-only producers and block producers are selected in each epoch from the proposals of participants in the network. Additionally, we will specify the algorithm for assigning those chunk-only producers and block producers to be the one responsible for producing the chunk/block at each height and for each shard.
There are several desiderata for these algorithms:
- Larger stakes should be preferred (more staked tokens means more security)
- The frequency with which a given participant is selected to produce a particular chunk/block is proportional to that participant's stake
- All participants selected as chunk/block producers should be selected to produce at least one chunk/block during the epoch
- It should be possible to determine which chunk/block producer is supposed to produce the chunk/block at height , for any within the epoch, in constant time
- The block producer chosen at height should have been a chunk producer for some shard at height , this minimizes network communication between chunk producers and block producers
- The number of distinct chunk-only/block producers should be as large as is allowed by the scalability in the consensus algorithm (too large and the system would be too slow, too small and the system would be too centralized)
Note: By "distinct block producers" we mean the number of different signing keys. We recognize it is possible for a single "logical entity" to split their stake into two or more proposals (Sybil attack), however steps to prevent this kind of attack against centralization are out of scope for this document.
Assumptions
- The maximum number of distinct chunk-only producers and block producers supported by the consensus
algorithm is a fixed constant. This will be a parameter of the protocol itself (i.e. all nodes
must agree on the constant). In this document, we will denote the maximum number of chunk-only
producers as
MAX_NUM_CPand the maximum number of block producers byMAX_NUM_BP. - The minimum number of blocks in the epoch is known at the time of block producer selection. This
minimum does not need to be incredibly accurate, but we will assume it is within a factor of 2 of
the actual number of blocks in the epoch. In this document we will refer to this as the "length of
the epoch", denoted by
epoch_length. - To meet the requirement that any chosen validator will be selected to produce at least one
chunk/block in the epoch, we assume it is acceptable for the probability of this not happening
to be sufficiently low. Let
PROBABILITY_NEVER_SELECTEDbe a protocol constant which gives the maximum allowable probability that the chunk-only/block producer with the least stake will never be selected to produce a chunk/block during the epoch. We will additionally assume the chunk/block producer assigned to make each chunk/block is chosen independently, and in proportion to the participant's stake. Therefore, the probability that the block producer with least stake is never chosen is given by the expression , where is the least stake of any block producer and is the total relevant stake (what stake is "relevant" depends on whether the validator is a chunk-only producer or a block producer; more details below). Hence, the algorithm will enforce the condition .
In mainnet and testnet, epoch_length is set to 43200. Let ,
we obtain, .
Algorithm for selecting block and chunk producers
A potential validator cannot specify whether they want to become a block producer or a chunk-only producer. There is only one type of proposal. The same algorithm is used for selecting block producers and chunk producers, but with different thresholds. The threshold for becoming block producers is higher, so if a node is selected as a block producer, it will also be a chunk producer, but not the other way around. Validators who are selected as chunk producers but not block producers are chunk-only producers.
select_validators
Input
max_num_validators: u16max number of validators to be selectedmin_stake_fraction: Ratio<u128>minimum stake ratio for selected validatorvalidator_proposals: Vec<ValidatorStake>(proposed stakes for the next epoch from nodes sending staking transactions)
Output
(validators: Vec<ValidatorStake>, sampler: WeightedIndex)
Steps
sorted_proposals =
    sorted_descending(validator_proposals, key=lambda v: (v.stake, v.account_id))

total_stake = 0

validators = []
for v in sorted_proposals[0:max_num_validators]:
    total_stake += v.stake
    if (v.stake / total_stake) > min_stake_fraction:
        validators.append(v)
    else:
        break

validator_sampler = WeightedIndex([v.stake for v in validators])

return (validators, validator_sampler)
Algorithm for selecting block producers
Input
MAX_NUM_BP: u16Max number of block producers, see Assumptionsmin_stake_fraction: Ratio<u128>, see Assumptionsvalidator_proposals: Vec<ValidatorStake>(proposed stakes for the next epoch from nodes sending staking transactions)
select_validators(MAX_NUM_BP, min_stake_fraction, validator_proposals)
Algorithm for selecting chunk producers
Input
MAX_NUM_CP: u16max number of chunk producers, see Assumptionsmin_stake_fraction: Ratio<u128>, see Assumptionsnum_shards: u64number of shardsvalidator_proposals: Vec<ValidatorStake>(proposed stakes for the next epoch from nodes sending staking transactions)
select_validators(MAX_NUM_CP, min_stake_fraction/num_shards, validator_proposals)
The reasoning for using min_stake_fraction/num_shards as the threshold here is that
we will assign chunk producers to shards later and the algorithm (described below) will try to assign
them in a way that the total stake in each shard is distributed as evenly as possible.
So the total stake in each shard will be roughly be total_stake_all_chunk_producers / num_shards.
Algorithm for assigning chunk producers to shards
Note that block producers are a subset of chunk producers, so this algorithm will also assign block producers to shards. This also means that a block producer may only be assigned to a subset of shards. For the security of the protocol, all block producers must track all shards, even if they are not assigned to produce chunks for all shards. We enforce that in the implementation level, not the protocol level. A validator node will panic if it doesn't track all shards.
Input
chunk_producers: Vec<ValidatorStake>num_shards: usizemin_validators_per_shard: usize
Output
validator_shard_assignments: Vec<Vec<ValidatorStake>>- -th element gives the validators assigned to shard
Steps
- While any shard has fewer than
min_validators_per_shardvalidators assigned to it:- Let
cp_ibe the next element ofchunk_producers(cycle back to the beginning as needed)- Note: if there are more shards than chunk producers, then some chunk producers will be assigned to multiple shards. This is undesirable because we want each chunk-only producer to be a assigned to exactly one shard. However, block producers are also chunk producers, so even if we must wrap around a little, chunk-only producers may still not be assigned multiple shards. Moreover, we assume that in practice there will be many more chunk producers than shards (in particular because block producers are also chunk producers).
- Let
shard_idbe the shard with the fewest number of assigned validators such thatcp_ihas not been assigned toshard_id - Assign
cp_itoshard_id
- Let
- While there are any validators which have not been assigned to any shard:
- Let
cp_ibe the next validator not assigned to any shard - Let
shard_idbe the shard with the least total stake (total stake = sum of stakes of all validators assigned to that shard) - Assign
cp_itoshard_id
- Let
- Return the shard assignments
In addition to the above description, we have a proof-of-concept (PoC) on GitHub. Note: this PoC has not been updated since the change to Simple Nightshade, so it assumes we are assigning block producers to shards. However, the same algorithm works to assign chunk producers to shards; it is only a matter of renaming variables referencing "block producers" to reference "chunk producers" instead.
Algorithm for sampling validators proportional to stake
We sample validators with probability proportional to their stake using the following data structure.
weighted_sampler: WeightedIndex- Allow sampling
- This structure will be based on the WeightedIndex implementation (see a description of Vose's Alias Method for details)
This algorithm is applied using both chunk-only producers and block producers in the subsequent algorithms for selecting a specific block producer and chunk producer at each height.
Input
rng_seed: [u8; 32]- See usages of this algorithm below to see how this seed is generated
validators: Vec<ValidatorStake>sampler: WeightedIndex
Output
selection: ValidatorStake
Steps
# The seed is used as an entropy source for the random numbers.
# The first 8 bytes select a block producer uniformly.
uniform_index = int.from_bytes(rng_seed[0:8], byteorder='little') % len(validators)

# The next 16 bytes uniformly pick some weight between 0 and the total
# weight (i.e. stake) of all block producers.
let uniform_weight = int.from_bytes(rng_seed[8:24], byteorder='little') \
    % sampler.weight_sum()

# Return either the uniformly selected block producer, or its "alias"
# depending on the uniformly selected weight.
index = uniform_index \
    if uniform_weight < sampler.no_alias_odds[uniform_index] \
    else sampler.aliases[uniform_index]

return validators[index]
Algorithm for selecting producer of block at height
Input
h: BlockHeight- Height to compute the block producer for
- Only heights within the epoch corresponding to the given block producers make sense as input
block_producers: Vec<ValidatorStake>(output from above)block_producer_sampler: WeightedIndexepoch_rng_seed: [u8; 32]- Fixed seed for the epoch determined from Verified Random Function (VRF) output of last block in the previous epoch
Output
block_producer: ValidatorStake
Steps
# Concatenates the bytes of the epoch seed with the height,
# then computes the sha256 hash.
block_seed = combine(epoch_rng_seed, h)

# Use the algorithm defined above
return select_validator(rng_seed=block_seed, validators=block_producers, sampler=block_producer_sampler)
Algorithm for selection of chunk producer at height for all shards
Input
- (same inputs as selection of block producer at height h)
num_shards: usizechunk_producer_sampler: Vec<WeightedIndex>(outputs from chunk-only producer selection)validator_shard_assignments: Vec<Vec<ValidatorStake>>
Output
chunk_producers: Vec<ValidatorStake>ith element gives the validator that will produce the chunk for shardi. Note: at least one of these will be a block producer, while others will be chunk-only producers.
Steps
bp = block_producer_at_height(
    h + 1,
    block_producers,
    block_producer_sampler,
    epoch_rng_seed,
)

result = []
for shard_id in range(num_shards):
    # concatenate bytes and take hash to create unique seed
    shard_seed = combine(epoch_rng_seed, h, shard_id)
    # Use selection algorithm defined above
    cp = select_validator(
        rng_seed=shard_seed,
        validators=validator_shard_assignments[shard_id],
        sampler=chunk_producer_sampler[shard_id]
    )
    result.append(cp)

# Ensure the block producer for the next block also produces one of the shards.
# `bp` could already be in the result because block producers are also
# chunk producers (see algorithm for selecting chunk producers from proposals).
if bp not in result:
    # select a random shard for the block producer to also create the chunk for
    rand_shard_seed = combine(epoch_rng_seed, h)
    bp_shard_id = int.from_bytes(rand_shard_seed[0:8], byteorder='little') % num_shards
    result[bp_shard_id] = bp

return result
Transactions in the Blockchain Layer
A client creates a transaction, computes the transaction hash and signs this hash to get a signed transaction. Now this signed transaction can be sent to a node.
When a node receives a new signed transaction, it validates the transaction (if the node tracks the shard) and gossips about it to all its peers. Eventually, the valid transaction is added to a transaction pool.
Every validating node has its own transaction pool. The transaction pool maintains transactions that were either not yet discarded, or not yet included onto the chain.
Before producing a chunk, transactions are ordered and validated again. This is done to produce chunks with only valid transactions.
Transaction ordering
The transaction pool groups transactions by a pair of (signer_id, signer_public_key).
The signer_id is the account ID of the user who signed the transaction, the signer_public_key is the public key of the account's access key that was used to sign the transactions.
Transactions within a group are not ordered.
The valid order of the transactions in a chunk is the following:
- transactions are ordered in batches.
- within a batch all transactions keys should be different.
- a set of transaction keys in each subsequent batch should be a sub-set of keys from the previous batch.
- transactions with the same key should be ordered in strictly increasing order of their corresponding nonces.
Note:
- the order within a batch is undefined. Each node should use a unique secret seed for that ordering to prevent users from finding the lowest keys, and then using that information to take advantage of every node.
Transaction pool provides a draining structure that allows it to pull transactions in a proper order.
Transaction validation
The transaction validation happens twice, once before adding it to the transaction pool, then before adding it to a chunk.
Before adding to a transaction pool
This is done to quickly filter out transactions that have an invalid signature or are invalid on the latest state.
Before adding to a chunk
A chunk producer has to create a chunk with valid and ordered transactions limited by two criteria:
- the maximum number of transactions for a chunk.
- the total gas burnt for transactions within a chunk.
To order and filter transactions, the chunk producer gets a pool iterator and passes it to the runtime adapter. The runtime adapter pulls transactions one by one. The valid transactions are added to the result; invalid transactions are discarded. Once one of the chunk limits is reached, all the remaining transactions from the iterator are returned back to the pool.
Pool iterator
Pool Iterator is a trait that iterates over transaction groups until all transaction group are empty. Pool Iterator returns a mutable reference to a transaction group that implements a draining iterator. The draining iterator is like a normal iterator, but it removes the returned entity from the group. It pulls transactions from the group in order from the smallest nonce to largest.
The pool iterator and draining iterators for transaction groups allow the runtime adapter to create proper order. For every transaction group, the runtime adapter keeps pulling transactions until the valid transaction is found. If the transaction group becomes empty, then it's skipped.
The runtime adapter may implement the following code to pull all valid transactions:
#![allow(unused)]
fn main() {
let mut valid_transactions = vec![];
let mut pool_iter = pool.pool_iterator();
while let Some(group_iter) = pool_iter.next() {
    while let Some(tx) = group_iter.next() {
        if is_valid(tx) {
            valid_transactions.push(tx);
            break;
        }
    }
}
valid_transactions
}
Transaction ordering example using pool iterator
Let's say:
- account IDs as uppercase letters (
"A","B","C"...) - public keys are lowercase letters (
"a","b","c"...) - nonces are numbers (
1,2,3...)
A pool might have group of transactions in the hashmap:
transactions: {
  ("A", "a") -> [1, 3, 2, 1, 2]
  ("B", "b") -> [13, 14]
  ("C", "d") -> [7]
  ("A", "c") -> [5, 2, 3]
}
There are 3 accounts ("A", "B", "C"). Account "A" used 2 public keys ("a", "c"). Other accounts used 1 public key each.
Transactions within each group may have repeated nonces while in the pool.
That's because the pool doesn't filter transactions with the same nonce, only transactions with the same hash.
For this example, let's say that transactions are valid if the nonce is even and strictly greater than the previous nonce for the same key.
Initialization
When .pool_iterator() is called, a new PoolIteratorWrapper is created and it holds the mutable reference to the pool,
so the pool can't be modified outside of this iterator. The wrapper looks like this:
pool: {
    transactions: {
      ("A", "a") -> [1, 3, 2, 1, 2]
      ("B", "b") -> [13, 14]
      ("C", "d") -> [7]
      ("A", "c") -> [5, 2, 3]
    }
}
sorted_groups: [],
sorted_groups is a queue of sorted transaction groups that were already sorted and pulled from the pool.
Transaction #1
The first group to be selected is for key ("A", "a"), the pool iterator sorts transactions by nonces and returns the mutable references to the group. Sorted nonces are:
[1, 1, 2, 2, 3]. Runtime adapter pulls 1, then 1, and then 2. Both transactions with nonce 1 are invalid because of odd nonce.
Transaction with nonce 2 is even, and since we don't know of any previous nonces, it is valid, and therefore added to the list of valid transactions.
Since the runtime adapter found a valid transaction, the transaction group is dropped, and the pool iterator wrapper becomes the following:
pool: {
    transactions: {
      ("B", "b") -> [13, 14]
      ("C", "d") -> [7]
      ("A", "c") -> [5, 2, 3]
    }
}
sorted_groups: [
  ("A", "a") -> [2, 3]
],
Transaction #2
The next group is for key ("B", "b"), the pool iterator sorts transactions by nonce and returns the mutable references to the group. Sorted nonces are:
[13, 14]. Runtime adapter pulls 13, then 14. The transaction with nonce 13 is invalid because of odd nonce.
Transaction with nonce 14 is added to the list of valid transactions.
The transaction group is dropped, but it's empty, so the pool iterator drops it completely:
pool: {
    transactions: {
      ("C", "d") -> [7]
      ("A", "c") -> [5, 2, 3]
    }
}
sorted_groups: [
  ("A", "a") -> [2, 3]
],
Transaction #3
The next group is for key ("C", "d"), the pool iterator sorts transactions by nonces and returns the mutable references to the group. Sorted nonces are:
[7]. Runtime adapter pulls 7. The transaction with nonce 7 is invalid because of odd nonce.
No valid transactions is added for this group.
The transaction group is dropped, it's empty, so the pool iterator drops it completely:
pool: {
    transactions: {
      ("A", "c") -> [5, 2, 3]
    }
}
sorted_groups: [
  ("A", "a") -> [2, 3]
],
The next group is for key ("A", "c"), the pool iterator sorts transactions by nonces and returns the mutable references to the group. Sorted nonces are:
[2, 3, 5]. Runtime adapter pulls 2.
It's a valid transaction, so it's added to the list of valid transactions.
Again, the transaction group is dropped, it's empty, so the pool iterator drops it completely:
pool: {
    transactions: { }
}
sorted_groups: [
  ("A", "a") -> [2, 3]
  ("A", "c") -> [3, 5]
],
Transaction #4
The next group is pulled not from the pool, but from the sorted_groups. The key is ("A", "a").
It's already sorted, so the iterator returns the mutable reference. Nonces are:
[2, 3]. Runtime adapter pulls 2, then pulls 3.
The transaction with nonce 2 is invalid, because we've already pulled a transaction #1 from this group and it had nonce 2.
The new nonce has to be larger than the previous nonce, so this transaction is invalid.
The transaction with nonce 3 is invalid because of odd nonce.
No valid transactions are added for this group.
The transaction group is dropped, it's empty, so the pool iterator drops it completely:
pool: {
    transactions: { }
}
sorted_groups: [
  ("A", "c") -> [3, 5]
],
The next group is for key ("A", "c"), with nonces [3, 5].
Runtime adapter pulls 3, then pulls 5. Both transactions are invalid, because the nonce is odd.
No transactions are added.
The transaction group is dropped, the pool iterator wrapper becomes empty:
pool: {
    transactions: { }
}
sorted_groups: [ ],
When runtime adapter tries to pull the next group, the pool iterator returns None, so the runtime adapter drops the iterator.
Dropping iterator
If the iterator was not fully drained, but some transactions still remained, they would be reinserted back into the pool.
Chunk Transactions
Transactions that were pulled from the pool:
// First batch
("A", "a", 1),
("A", "a", 1),
("A", "a", 2),
("B", "b", 13),
("B", "b", 14),
("C", "d", 7),
("A", "c", 2),

// Next batch
("A", "a", 2),
("A", "a", 3),
("A", "c", 3),
("A", "c", 5),
The valid transactions are:
("A", "a", 2),
("B", "b", 14),
("A", "c", 2),
In total there were only 3 valid transactions that resulted in one batch.
Order validation
Other validators need to check the order of transactions in the produced chunk. It can be done in linear time using a greedy algorithm.
To select a first batch we need to iterate over transactions one by one until we see a transaction with the key that we've already included in the first batch. This transaction belongs to the next batch.
Now all transactions in the N+1 batch should have a corresponding transaction with the same key in the N batch. If there are no transaction with the same key in the N batch, then the order is invalid.
We also enforce the order of the sequence of transactions for the same key, the nonces of them should be in strictly increasing order.
Here is the algorithm that validates the order:
#![allow(unused)]
fn main() {
fn validate_order(txs: &Vec<Transaction>) -> bool {
    let mut nonces: HashMap<Key, Nonce> = HashMap::new();
    let mut batches: HashMap<Key, usize> = HashMap::new();
    let mut current_batch = 1;

    for tx in txs {
        let key = tx.key();

        // Verifying nonce
        let nonce = tx.nonce();
        if let Some(last_nonce) = nonces.get(key) {
            if nonce <= last_nonce {
                // Nonces should increase.
                return false;
            }
        }
        nonces.insert(key, nonce);

        // Verifying batch
        if let Some(last_batch) = batches.get(key) {
            if last_batch == current_batch {
                current_batch += 1;
            } else if last_batch < current_batch - 1 {
                // Was skipped this key in the previous batch
                return false;
            }
        } else {
            if current_batch > 1 {
                // Not in first batch
                return false;
            }
        }
        batches.insert(key, batch);
    }
    true
}
}
Upgradability
This part of specification describes specifics of upgrading the protocol, and touches on few different parts of the system.
Three different levels of upgradability are:
- Updating without any changes to underlying data structures or protocol;
- Updating when underlying data structures changed (config, database or something else internal to the node and probably client specific);
- Updating with protocol changes that all validating nodes must adjust to.
Versioning
There are 2 different important versions:
- Version of binary defines it's internal data structures / database and configs. This version is client specific and doesn't need to be matching between nodes.
- Version of the protocol, defining the "language" nodes are speaking.
#![allow(unused)]
fn main() {
/// Latest version of protocol that this binary can work with.
type ProtocolVersion = u32;
}
Client versioning
Clients should follow semantic versioning. Specifically:
- MAJOR version defines protocol releases.
- MINOR version defines changes that are client specific but require database migration, change of config or something similar. This includes client-specific features. Client should execute migrations on start, by detecting that information on disk is produced by previous version and auto-migrate it to new one.
- PATCH version defines when bug fixes, which should not require migrations or protocol changes.
Clients can define how current version of data is stored and migrations applied. General recommendation is to store version in the database and on binary start, check version of database and perform required migrations.
Protocol Upgrade
Generally, we handle data structure upgradability via enum wrapper around it. See BlockHeader structure for example.
Versioned data structures
Given we expect many data structures to change or get updated as protocol evolves, a few changes are required to support that.
The major one is adding backward compatible Versioned data structures like this one:
#![allow(unused)]
fn main() {
enum VersionedBlockHeader {
    BlockHeaderV1(BlockHeaderV1),
    /// Current version, where `BlockHeader` is used internally for all operations.
    BlockHeaderV2(BlockHeader),
}
}
Where VersionedBlockHeader will be stored on disk and sent over the wire.
This allows to encode and decode old versions (up to 256 given https://borsh.io specification). If some data structures has more than 256 versions, old versions are probably can be retired and reused.
Internally current version is used. Previous versions either much interfaces / traits that are defined by different components or are up-casted into the next version (saving for hash validation).
Consensus
| Name | Value |
|---|---|
PROTOCOL_UPGRADE_BLOCK_THRESHOLD | 80% |
PROTOCOL_UPGRADE_NUM_EPOCHS | 2 |
The way the version will be indicated by validators, will be via
#![allow(unused)]
fn main() {
/// Add `version` into block header.
struct BlockHeaderInnerRest {
    ...
    /// Latest version that current producing node binary is running on.
    version: ProtocolVersion,
}
}
The condition to switch to next protocol version is based on % of stake PROTOCOL_UPGRADE_NUM_EPOCHS epochs prior indicated about switching to the next version:
def next_epoch_protocol_version(last_block):
    """Determines next epoch's protocol version given last block."""
    epoch_info = epoch_manager.get_epoch_info(last_block)
    # Find epoch that decides if version should change by walking back.
    for _ in PROTOCOL_UPGRADE_NUM_EPOCHS:
        epoch_info = epoch_manager.prev_epoch(epoch_info)
        # Stop if this is the first epoch.
        if epoch_info.prev_epoch_id == GENESIS_EPOCH_ID:
            break
    versions = collections.defaultdict(0)
    # Iterate over all blocks in previous epoch and collect latest version for each validator.
    authors = {}
    for block in epoch_info:
        author_id = epoch_manager.get_block_producer(block.header.height)
        if author_id not in authors:
            authors[author_id] = block.header.rest.version
    # Weight versions with stake of each validator.
    for author in authors:
        versions[authors[author] += epoch_manager.validators[author].stake
    (version, stake) = max(versions.items(), key=lambda x: x[1])
    if stake > PROTOCOL_UPGRADE_BLOCK_THRESHOLD * epoch_info.total_block_producer_stake:
        return version
    # Otherwise return version that was used in that deciding epoch.
    return epoch_info.version
Epochs and Staking
Epoch
All blocks are split into epochs. Within one epoch, the set of validators is fixed, and validator rotation happens at epoch boundaries.
Genesis block is in its own epoch. After that, a block is either in its parent's epoch or starts a new epoch if it meets certain conditions.
Within one epoch, validator assignment is based on block height: each height has a block producer assigned to it, and each height and shard have a chunk producer.
End of an epoch
Let estimated_next_epoch_start = first_block_in_epoch.height + epoch_length
A block is defined to be the last block in its epoch if it's the genesis block or if the following condition is met:
block.last_finalized_height + 3 >= estimated_next_epoch_start
epoch_length is defined in genesis_config and has a value of 43200 height delta on mainnet (12 hours at 1 block per second).
Since every final block must have two more blocks on top of it, it means that the last block in an epoch will have a height of at least block.last_finalized_height + 2, so for the last block it holds that block.height + 1 >= estimated_next_epoch_start. Its height will be at least estimated_next_epoch_start - 1.
Note that an epoch only ends when there is a final block above a certain height. If there are no final blocks, the epoch will be stretched until the required final block appears. An epoch can potentially be longer than epoch_length.

EpochHeight
Epochs on one chain can be identified by height, which is defined the following way:
- Special epoch that contains genesis block only: undefined
- Epoch starting from the block that's after genesis:
0(NOTE: in current implementation it's1due to a bug, so there are two epochs with height1) - Following epochs: height of the parent epoch plus one
Epoch id
Every block stores the id of its epoch - epoch_id.
Epoch id is defined as
- For special genesis block epoch it's
0 - For epoch with height
0it's0(NOTE: the first two epochs use the same epoch id) - For epoch with height
1it's the hash of genesis block - For epoch with height
T+2it's the hash of the last block in epochT
Epoch end
- After processing the last block of epoch
T,EpochManageraggregates information from block of the epoch, and computes validator set for epochT+2. This process is described in EpochManager. - After that, the validator set rotates to epoch
T+1, and the next block is produced by the validator from the new set - Applying the first block of epoch
T+1, in addition to a normal transition, also applies the per-epoch state transitions: validator rewards, stake unlocks and slashing.
EpochManager
Finalizing an epoch
At the last block of epoch T, EpochManager computes EpochInfo for epoch T+2, which
is defined by EpochInfo for T+1 and the information aggregated from blocks of epoch T.
EpochInfo is all the information that EpochManager stores for the epoch, which is:
epoch_height: epoch height (T+2)validators: the list of validators selected for epochT+2validator_to_index: Mapping from account id to index invalidatorsblock_producers_settlement: defines the mapping from height to block producerchunk_producers_settlement: defines the mapping from height and shard id to chunk producerhidden_validators_settlement: TODOfishermen,fishermen_to_index: TODO. disabled on mainnet through a largefishermen_thresholdin configstake_change: TODOvalidator_reward: validator reward for epochTvalidator_kickout: see Kickout setminted_amount: minted tokens in epochTseat_price: seat price of the epochprotocol_version: TODO
Aggregating blocks of the epoch computes the following sets:
block_stats/chunk_stats: uptime statistics in the form ofproducedandexpectedblocks/chunks for each validator ofTproposals: stake proposals made in epochT. If an account made multiple proposals, the last one is used.slashes: see Slash set
Slash set
NOTE: slashing is currently disabled. The following is the current design, which can change.
Slash sets are maintained on block basis. If a validator gets slashed in epoch T, subsequent blocks of epochs T and
T+1 keep it in their slash sets. At the end of epoch T, the slashed validator is also added to kickout[T+2].
Proposals from blocks in slash sets are ignored.
It's kept in the slash set (and kickout sets) for two or three epochs depending on whether it was going to be a validator in T+1:
- Common case:
vis invalidators[T]and invalidators[T+1]- proposals from
vinT,T+1andT+2are ignored vis added tokickout[T+2],kickout[T+3]andkickout[T+4]as slashedvcan stake again starting with the first block ofT+3.
- proposals from
- If
vis invalidators[T]but not invalidators[T+1](e.g. if it unstaked inT-1)- proposals from
vinTandT+1are ignored vis added tokickout[T+2]andkickout[T+3]as slashedvcan make a proposal inT+2to become a validator inT+4
- proposals from
- If
vis invalidators[T-1]but not invalidators[T](e.g. did slashable behavior right before rotating out)- proposals from
vinTandT+1are ignored vis added tokickout[T+2]andkickout[T+3]as slashedvcan make a proposal inT+2to become a validator inT+4
- proposals from
Computing EpochInfo
Kickout set
kickout[T+2] contains validators of epoch T+1 that stop being validators in T+2, and also accounts that are not
necessarily validators of T+1, but are kept in slashing sets due to the rule described above.
kickout[T+2] is computed the following way:
Slashed: accounts in the slash set of the last block inTUnstaked: accounts that remove their stake in epochT, if their stake is non-zero for epochT+1NotEnoughBlocks/NotEnoughChunks: For each validator compute the ratio of blocks produced to expected blocks produced (same with chunks produced/expected). If the percentage is belowblock_producer_kickout_threshold(chunk_producer_kickout_threshold), the validator is kicked out.- Exception: If all validators of
Tare either inkickout[T+1]or to be kicked out, we don't kick out the validator with the maximum number of blocks produced. If there are multiple, we choose the one with lowest validator id in the epoch.
- Exception: If all validators of
NotEnoughStake: computed after validator selection. Accounts who have stake in epochT+1, but don't meet stake threshold for epochT+2.DidNotGetASeat: computed after validator selection. Accounts who have stake in epochT+1, meet stake threshold for epochT+2, but didn't get any seats.
Processing proposals
The set of proposals is processed by the validator selection algorithm, but before that, the set of proposals is adjusted the following way:
- If an account is in the slash set as of the end of
T, or gets kicked out forNotEnoughBlocks/NotEnoughChunksin epochT, its proposal is ignored. - If a validator is in
validators[T+1], and didn't make a proposal, add an implicit proposal with its stake inT+1. - If a validator is in both
validators[T]andvalidators[T+1], and made a proposal inT(including implicit), then its reward for epochTis automatically added to the proposal.
The adjusted set of proposals is used to compute the seat price, and determine validators,block_producers_settlement,
chunk_producers_settlementsets. This algorithm is described in Economics.
Validator reward
Rewards calculation is described in the Economics section.
Staking and slashing
Stake invariant
Account has two fields representing its tokens: amount and locked. amount + locked is the total number of
tokens an account has: locking/unlocking actions involve transferring balance between the two fields, and slashing
is done by subtracting from the locked value.
On a stake action the balance gets locked immediately (but the locked balance can only increase), and the stake proposal is passed to the epoch manager. Proposals get accumulated during an epoch and get processed all at once when an epoch is finalized. Unlocking only happens at the start of an epoch.
Account's stake is defined per epoch and is stored in EpochInfo's validators and fishermen sets. locked is always
equal to the maximum of the last three stakes and the highest proposal in the current epoch.
Returning stake
locked is the number of tokens locked for staking, it's computed the following way:
- initially it's the value in genesis or
0for new accounts - on a staking proposal with a value higher than
locked, it increases to that value - at the start of each epoch it's recomputed:
- consider the most recent 3 epochs
- for non-slashed accounts, take the maximum of their stakes in those epochs
- if an account made a proposal in the block that starts the epoch, also take the maximum with the proposal value
- change
lockedto the resulting value (and updateamountso thatamount + lockedstays the same)
Slashing
TODO.
Network
Network layer constitutes the lower level of the NEAR protocol and is ultimately responsible of transporting messages between peers. To provide an efficient routing it maintains a routing table between all peers actively connected to the network, and sends messages between them using best paths. There is a mechanism in place that allows new peers joining the network to discover other peers, and rebalance network connections in such a way that latency is minimized. Cryptographic signatures are used to check identities from peers participating in the protocol since it is non-permissioned system.
This document should serve as reference for all the clients to implement networking layer.
Messages
Data structures used for messages between peers are enumerated in Message.
Discovering the network
When a node starts for the first time it tries to connect to a list of bootstrap nodes specified via a config file. The address for each node
It is expected that a node periodically requests a list of peers from its neighboring nodes to learn about other nodes in the network. This will allow every node to discover each other, and have relevant information to try to establish a new connection with it. When a node receives a message of type PeersRequest it is expected to answer with a message of type PeersResponse with information from healthy peers known to this node.
Handshakes
To establish a new connections between pair of nodes, they will follow the following protocol. Node A open a connection with node B and sends a Handshake to it. If handshake is valid (see reasons to decline the handshake) then node B will proceed to send Handshake to node A. After each node accept a handshake it will mark the other node as an active connection, until one of them stop the connection.
Handshake contains relevant information about the node, the current chain and information to create a new edge between both nodes.
Decline handshake
When a node receives a handshake from other node it will decline this connection if one of the following situations happens:
- Other node has different genesis.
- Edge nonce is too low
Edge
Edges are used to let other nodes in the network know that there is currently an active connection between a pair of nodes. See the definition of this data structure.
If the nonce of the edge is odd, it denotes an Added edge, otherwise it denotes a Removed edge. Each node should keep track of the nonce used for edges between every pair of nodes. Peer C believes that the peers A and B are currently connected if and only if the edge with the highest nonce known to C for them has an odd nonce.
When two nodes successfully connect to each other, they broadcast the new edge to let other peers know about this connection. When a node is disconnected from other node, it should bump the nonce by 1, sign the new edge and broadcast it to let other nodes know that the connection was removed.
A removed connection will be valid, if it contains valid information from the added edge it is invalidating. This prevents peers bump nonce by more than one when deleting an edge.
When node A proposes an edge to B with nonce X, it will only accept it and sign it iff:
- X = 1 and B doesn't know about any previous edge between A and B
- X is odd and X > Y where Y is the nonce of the edge with the highest nonce between A and B known to B.
Routing Table
Every node maintains a routing table with all existing connections and relevant information to route messages. The explicit graph with all active connection is stored at all times.
#![allow(unused)]
fn main() {
struct RoutingTable {
    /// PeerId associated for every known account id.
    account_peers: HashMap<AccountId, AnnounceAccount>,
    /// Active PeerId that are part of the shortest path to each PeerId.
    peer_forwarding: HashMap<PeerId, HashSet<PeerId>>,
    /// Store last update for known edges.
    edges_info: HashMap<(PeerId, PeerId), Edge>,
    /// Hash of messages that requires routing back to respective previous hop.
    route_back: HashMap<CryptoHash, PeerId>,
    /// Current view of the network. Nodes are Peers and edges are active connections.
    raw_graph: Graph,
}

}
-
account_peersis a mapping from each known account to the correspondent announcement. Given that validators are known by its AccountId when a node needs to send a message to a validator it finds the PeerId associated with the AccountId in this table. -
peer_forwarding: For nodeS,peer_forwardingconstitutes a mapping from each PeerIdT, to the set of peers that are directly connected toSand belong to the shortest route, in terms of number of edges, betweenSandT. When nodeSneeds to send a message to nodeTand they are not directly connected,Schoose one peer among the setpeer_forwarding[S]and sends a routed message to it with destinationT.
-
edges_infois a mapping between each unordered pair of peersAandBto the edge with highest nonce known between those peers. It might be -
route_backused to compute the route for certain messages. Read more about it on Routing back section -
raw_graphis the explicit graph representation of the network. Each vertex of this graph is a peer, and each edge is an active connection between a pair of peers, i.e. the edge with highest nonce between this pair of peers is of typeAdded. It is used to compute the shortest path from the source to all other peers.
Updates
RoutingTable should be update accordingly when the node receives updates from the network:
- New edges:
edges_infomap is updated with new edges if their nonce is higher. This is relevant to know whether a new connection was created, or some connection stopped.
def on_edges_received(self, edges):
    for edge in edges:
        # Check the edge is valid
        if edge.is_valid():
            peer0 = edge.peer0
            peer1 = edge.peer1

            # Find edge with higher nonce known up to this point.
            current_edge = self.routing_table.edges_info.get((peer0, peer1))

            # If there is no known edge, or the known edge has smaller nonce
            if current_edge is None or current_edge.nonce < edge.nonce:
                # Update with the new edge
                self.routing_table.edges_info[(peer0, peer1)] = edge
- Announce account:
account_peersmap is updated with announcements from more recent epochs.
def on_announce_accounts_received(self, announcements):
    for announce_account in announcements:
        # Check the announcement is valid
        if announce_account.is_valid():
            account_id = announce_account.account_id

            # Find most recent announcement for account_id being announced
            current_announce_account = self.routing_table.account_peers.get(account_id)

            # If new epoch is happens after current epoch.
            if announce_account.epoch > current_announce_account.epoch:
                # Update with the new announcement
                self.routing_table.account_peers[announce_id] = announce_account
- Route back messages: Read about it on Routing back section
Routing
When a node needs to send a message to another peer, it checks in the routing table if it is connected to that peer, possibly not directly but through several hops. Then it select one of the shortest path to the target peer and sends a RoutedMessage to the first peer in the path.
When it receives a RoutedMessage, it check if it is the target, in that case consume the body of the message, otherwise it finds a route to the target following described approach and sends the message again. It is important that before routing a message each peer check signature from original author of the message, passing a message with invalid signature can result in ban for the sender. It is not required however checking the content of the message itself.
Each RoutedMessage is equipped with a time-to-live integer. If this message is not for the node processing it, it decrement the field by one before routing it; if the value is 0, the node drops the message instead of routing it.
Routing back
It is possible that node A is known to B but not the other way around. In case node A sends a request that requires a response to B, the response is routed back through the same path used to send the message from A to B. When a node receives a RoutedMessage that requires a response it stores in the map route_back the hash of the message mapped to the PeerId of the sender. After the message reaches the final destination and response is computed it is routed back using as target the hash of the original message. When a node receives a Routed Message such that the target is a hash, the node checks for the previous sender in the route_back map, and sends the message to it if it exists, otherwise it drops the message.
The hash of a RoutedMessage to be stored on the map route_back is computed as:
def route_back_hash(routed_message):
    return sha256(concat(
        borsh(routed_message.target),
        borsh(routed_message.author),
        borsh(routed_message.body)
    ))
def send_routed_message(self, routed_message, sender):
    """
    sender: PeerId of the node through which the message was received.

    Don't confuse sender with routed_message.author:
    routed_message.author is the PeerId from the original creator of the message

    The only situation in which sender == routed_message.author is when the message was
    not received from the network, but was created by the node and should be routed.
    """
    if routed_message.requires_response():
        crypto_hash = route_back_hash(routed_message)
        self.routing_table.route_back[crypto_hash] = sender

    next_peer = self.find_closest_peer_to(routed_message.target)
    self.send_message(next_peer, routed_message)

def on_routed_message_received(self, routed_message, sender):
    # routed_message.target is of type CryptoHash or PeerId
    if isinstance(routed_message.target, CryptoHash):
        # This is the response for a routed message.
        # `target` is the PeerId that sent this message.
        target = self.routing_table.route_back.get(routed_message.target)

        if target is None:
            # Drop message if there is no known route back for it
            return
        else:
            del self.routing_table.route_back[routed_message.target]
    else:
        target = routed_message.target

    if target == self.peer_id:
        self.handle_message(routed_message.body)
    else:
        self.send_routed_message(routed_message, sender)
Synchronization
When two node connect to each other they exchange all known edges (from RoutingTable::edges_info) and account announcements (from RoutingTable::account_peers). Also they broadcast the newly created edge to all nodes directly connected to them. After a node learns about a new AnnounceAccount or a new Edge they automatically broadcast this information to the rest of the nodes, so everyone is kept up to date.
Security
Messages exchanged between peers (both direct or routed) are cryptographically signed with sender private key. Nodes ID contains public key of each node that allow other peer to verify this messages. To keep secure communication most of this message requires some nonce/timestamp that forbid a malicious actor reuse a signed message out of context.
In the case of routing messages each intermediate hop should verify that message hash and signatures are valid before routing to next hop.
Abusive behavior
When a node A sends more than MAX_PEER_MSG_PER_MIN messages per minute to node B, it will be banned and unable to keep sending messages to it. This a protection mechanism against abusive node to avoid being spammed by some peers.
Implementation Details
There are some issues that should be handled by the network layer but details about how to implement them are not enforced by the protocol, however we propose here how to address them.
Balancing network
Messages
All message sent in the network are of type PeerMessage. They are encoded using Borsh which allows a rich structure, small size and fast encoding/decoding. For details about data structures used as part of the message see the reference code.
Encoding
A PeerMessage is converted into an array of bytes (Vec<u8>) using borsh serialization. An encoded message is conformed by 4 bytes with the length of the serialized PeerMessage concatenated with the serialized PeerMessage.
Check Borsh specification details to see how it handles each data structure.
Data structures
PeerID
The id of a peer in the network is its PublicKey.
#![allow(unused)]
fn main() {
struct PeerId(PublicKey);
}
PeerInfo
#![allow(unused)]
fn main() {
struct PeerInfo {
    id: PeerId,
    addr: Option<SocketAddr>,
    account_id: Option<AccountId>,
}
}
PeerInfo contains relevant information to try to connect to other peer. SocketAddr is a tuple of the form: IP:port.
AccountID
#![allow(unused)]
fn main() {
type AccountId = String;
}
PeerMessage
#![allow(unused)]
fn main() {
enum PeerMessage {
    Handshake(Handshake),
    HandshakeFailure(PeerInfo, HandshakeFailureReason),
    /// When a failed nonce is used by some peer, this message is sent back as evidence.
    LastEdge(Edge),
    /// Contains accounts and edge information.
    Sync(SyncData),
    RequestUpdateNonce(EdgeInfo),
    ResponseUpdateNonce(Edge),
    PeersRequest,
    PeersResponse(Vec<PeerInfo>),
    BlockHeadersRequest(Vec<CryptoHash>),
    BlockHeaders(Vec<BlockHeader>),
    BlockRequest(CryptoHash),
    Block(Block),
    Transaction(SignedTransaction),
    Routed(RoutedMessage),
    /// Gracefully disconnect from other peer.
    Disconnect,
    Challenge(Challenge),
}
}
AnnounceAccount
Each peer should announce its account
#![allow(unused)]
fn main() {
struct AnnounceAccount {
    /// AccountId to be announced.
    account_id: AccountId,
    /// PeerId from the owner of the account.
    peer_id: PeerId,
    /// This announcement is only valid for this `epoch`.
    epoch_id: EpochId,
    /// Signature using AccountId associated secret key.
    signature: Signature,
}
}
Handshake
#![allow(unused)]
fn main() {
struct Handshake {
    /// Protocol version.
    pub version: u32,
    /// Oldest supported protocol version.
    pub oldest_supported_version: u32,
    /// Sender's peer id.
    pub peer_id: PeerId,
    /// Receiver's peer id.
    pub target_peer_id: PeerId,
    /// Sender's listening addr.
    pub listen_port: Option<u16>,
    /// Peer's chain information.
    pub chain_info: PeerChainInfoV2,
    /// Info for new edge.
    pub edge_info: EdgeInfo,
}
}
Edge
#![allow(unused)]
fn main() {
struct Edge {
    /// Since edges are not directed `peer0 < peer1` should hold.
    peer0: PeerId,
    peer1: PeerId,
    /// Nonce to keep tracking of the last update on this edge.
    nonce: u64,
    /// Signature from parties validating the edge. These are signature of the added edge.
    signature0: Signature,
    signature1: Signature,
    /// Info necessary to declare an edge as removed.
    /// The bool says which party is removing the edge: false for Peer0, true for Peer1
    /// The signature from the party removing the edge.
    removal_info: Option<(bool, Signature)>,
}
}
EdgeInfo
#![allow(unused)]
fn main() {
struct EdgeInfo {
    nonce: u64,
    signature: Signature,
}
}
RoutedMessage
#![allow(unused)]
fn main() {
struct RoutedMessage {
    /// Peer id which is directed this message.
    /// If `target` is hash, this a message should be routed back.
    target: PeerIdOrHash,
    /// Original sender of this message
    author: PeerId,
    /// Signature from the author of the message. If this signature is invalid we should ban
    /// last sender of this message. If the message is invalid we should ben author of the message.
    signature: Signature,
    /// Time to live for this message. After passing through some hop this number should be
    /// decreased by 1. If this number is 0, drop this message.
    ttl: u8,
    /// Message
    body: RoutedMessageBody,
}
}
RoutedMessageBody
#![allow(unused)]
fn main() {
enum RoutedMessageBody {
    BlockApproval(Approval),
    ForwardTx(SignedTransaction),

    TxStatusRequest(AccountId, CryptoHash),
    TxStatusResponse(FinalExecutionOutcomeView),
    QueryRequest {
        query_id: String,
        block_id_or_finality: BlockIdOrFinality,
        request: QueryRequest,
    },
    QueryResponse {
        query_id: String,
        response: Result<QueryResponse, String>,
    },
    ReceiptOutcomeRequest(CryptoHash),
    ReceiptOutComeResponse(ExecutionOutcomeWithIdAndProof),
    StateRequestHeader(ShardId, CryptoHash),
    StateRequestPart(ShardId, CryptoHash, u64),
    StateResponse(StateResponseInfo),
    PartialEncodedChunkRequest(PartialEncodedChunkRequestMsg),
    PartialEncodedChunkResponse(PartialEncodedChunkResponseMsg),
    PartialEncodedChunk(PartialEncodedChunk),
    Ping(Ping),
    Pong(Pong),
}
}
CryptoHash
CryptoHash are objects with 256 bits of information.
#![allow(unused)]
fn main() {
pub struct Digest(pub [u8; 32]);

pub struct CryptoHash(pub Digest);
}
Routing table exchange algorithm
- Proposal Name: New routing table exchange algorithm
- Start Date: 6/21/2021
- NEP PR:
nearprotocol/neps#0000 - Issue(s): https://github.com/near/nearcore/issues/3838.
- GitHub PR
Summary
Currently, every node on the network stores its own copy of the Routing Graph. The process of exchanging and verifying edges requires sending full copy of routing table on every synchronization. Sending full copy of routing table is wasteful, in this spec we propose a solution, which allows doing partial synchronization. This should reduce both bandwidth used, and amount of CPU time.
Typically, only one full sync would be required when a node connects to the network for the first time. For given two nodes doing synchronization, we propose a method, which requires bandwidth/processing time proportional to the size of data which needs to be exchanged for given nodes.
Algorithm
In this spec we describe the implementation of Routing Graph Reconciliation algorithm using Inverse Bloom Filters.
An overview of different Routing Graph Reconciliation algorithms can be a found at
ROUTING_GRAPH_RECONCILIATION.pdf
The process of exchanging routing tables involves exchanging edges between a pair of nodes.
For given nodes A, B, that involves adding edges which A has, but B doesn't and vice-versa.
For each connection we create a data structure IbfSet.
It stores Inverse Bloom Filters Ibf of powers of 2^k for k in range 10..17.
This allows us to recover around 2^17 / 1.3 edges with 99% probability according to Efficient Set Reconciliation without Prior Context.
Otherwise, we do full routing table exchange.
We have chosen a minimum size of Ibf to be 2^10, because the overhead of processing IBF of smaller size of negligible, and to reduce the number of messages required in exchange.
On the other side, we limit Ibf to size of 2^17 to reduce memory usage required for each data structure.
Routing Table
We are extending [Routing Table](NetworkSpec.md#Routing Table) by additional field peer_ibf_set
#![allow(unused)]
fn main() {
pub struct RoutingTable {
   /// Other fields
   ///    ..
   /// Data structure used for exchanging routing tables.
   pub peer_ibf_set: IbfPeerSet,
}
}
peer_ibf_set- a helper data structure, which allows doing partial synchronization.
IbfPeerSet
IbfPeerSet contains a mapping between PeerId and IbfSet.
It's used to store metadata for each peer, which can be used to compute set difference between routing tables of current peer and peer contained in the mapping.
#![allow(unused)]
fn main() {
pub struct SimpleEdge {
  pub key: (PeerId, PeerId),
  pub nonce: u64,
}

pub struct IbfPeerSet {
    peer2seed: HashMap<PeerId, u64>,
    unused_seeds: Vec<u64>,
    seed2ibf: HashMap<u64, IbfSet<SimpleEdge>>,
    slot_map: SlotMap,
    edges: u64,
}
}
peer2seed- contains a mapping fromPeerIdtoseedused to generateIbfSetunused_seeds- list of currently unused seeds, which will be used for new incoming connectionsseed2ibf- contains a mapping fromseedtoIbfSetslot_map- a helper data structure, which is used to storeEdges, this allows us to save memory by not storing duplicates.edges- total number of edges in the data structure
Messages
#![allow(unused)]
fn main() {
pub struct RoutingSyncV2 {
    pub version: u64,
    pub known_edges: u64,
    pub ibf_level: u64,
    pub ibf: Vec<IbfElem>,
    pub request_all_edges: bool,
    pub seed: u64,
    pub edges: Vec<Edge>,
    pub requested_edges: Vec<u64>,
    pub done: bool,
}
}
version- version of routing table, currently 0, for future useknown_edges- number of edges peer knows about, this allows us to decide whenever to request all edges immediately or not.ibf_level- level of inverse bloom filter requested from10to17.request_all_edges- true if peer decides to request all edges from other peerseed- seed used to generate ibfedges- list of edges send to the other peerrequested_edges- list of hashes of edges peer want to getdone- true if it's the last message in synchronization
IbfSet
Structure used to represent set of Inverse Bloom Filters for given peer.
#![allow(unused)]
fn main() {
pub struct IbfSet<T: Hash + Clone> {
    seed: u64,
    ibf: Vec<Ibf>,
    h2e: HashMap<u64, SlotMapId>,
    hasher: DefaultHasher,
    pd: PhantomData<T>,
}
}
seed- seed used to generate IbfSetibf- list ofInverse Bloom Filterswith sizes from10to17.h2e- mapping from hash of given edge to id of the edge. This is used to save memory, to avoid storing multiple copies of given edge.hasher- hashing function
Ibf
Structure representing Reverse Bloom Filter.
#![allow(unused)]
fn main() {
pub struct Ibf {
    k: i32,
    pub data: Vec<IbfElem>,
    hasher: IbfHasher,
    pub seed: u64,
}
}
k- number of elements in vectordata- vector of elements of bloom filterseed- seed of each inverse bloom filterhasher- hashing function
IbfElem
Element of bloom filter
#![allow(unused)]
fn main() {
pub struct IbfElem {
    xor_elem: u64,
    xor_hash: u64,
}
}
xor_element- xor of hashes of edges stored in given boxxor_hash- xor of hashes of hashes of edges stored in give n box
Routing table exchange
The process of exchanging routing tables involves multiple steps. It could be reduced if needed by adding an estimator of how many edges differ, but it's not implemented for sake of simplicity.
Step 1
Peer A connects to peer B.
Step 2
Peer B chooses unique seed, and generates IbfPeerSet based on seed and all known edges in
[Routing Table](NetworkSpec.md#Routing Table).
Step 3 - 10
On odd steps peer B sends message to peer A, with Ibf of size 2^(step+7).
On even steps, peer A does it.
- Case 1 - if we were unable to find all edges we continue to the next step.
- Case 2 - otherwise, we know what the set difference is. We compute the set of hashes of edges given node knows about, and doesn't know about. Current peer sends to the other peer the edges it knows about, and asks about edges, based on hashes, it doesn't know about the other peer. The other peer sends the response, and the routing table exchange ends.
Step 11
In case the synchronization isn't done yet, each side sends list of hashes of edges it knows about.
Step 12
Each side sends list of edges the other side requested.
Security considerations
Avoid extra computation if another peer reconnects to server
In order to avoid extra computation whenever a peer reconnects to server, we can keep a pool of IbfPeerSet structures.
The number of such structures which we need to keep is going to be equal to the peak number of incoming connections, which servers have had plus the number of outgoing connections.
Producing edges, where there is a hash collision
We use unique IbfPeerSet structure, for each connection, this prevents seeds to be guessed.
Therefore, we are resistant to that type of attack.
Memory overhead
For each connection we need to use approximately (2^10 + ... 2^17) * sizeof(IbfElem) bytes = 2^18 * 16 bytes = 4 MiB.
Assuming we keep extra 40 of such data structures, we would need extra 160 MiB.
Performance overhead
On each update we need up update each IbfSet structure 3*8 = 24 times.
Assuming we keep 40 such data structures, that requires up to 960 updates.
Alternative approaches
Only use one IbfPeerSet structure for everyone
This would reduce number of updates we need to do, and memory usage. However, it would be possible to guess the hash function used, which would expose us to security vulnerability. It would be simple to produce two edges, such that there is a hash collision, which would cause routing table exchange to fail.
Increase number of IbfSet structures per IbfPeerSet
In theory, we could increase the sizes of IBF structures used from 2^10..2^17 to 2^10..2^20.
This would allow us to recover the set difference if it's up to 2^20/3 instead of 2^17/3 at cost of increasing memory overhead from 160 MiB to 640 Mib.
Simplify algorithm to only exchange list of hashes of known edges of each peer
Each edge has a size of about 400 bytes.
Let's assume we need to send 1 million edges.
By sending list of 4 bytes hashes of all known edges on each synchronization we would only need to send 4 MiB of metadata plus the size of edges that differ.
This approach would be simpler, but not as efficient in terms of bandwidth.
That would still be an improvement of having to send just 4 MiB over 400 MiB with existing implementation.
Future improvements
Reduce memory usage
Used a fixed number of IbfPeerSet structures for each node Theoretically, smaller number of sets could be used. For example 10, this would require estimating how likely it is to produce edges such that they produce collisions
It may be still possible to generate offline such set of edges that can cause recovery of edges from IBF to fail for one node.
Overview
This chapter covers the NEAR Protocol runtime specification.
Runtime Specification
- Account Receipt Storage
- Actions
- Applying chunk
- Components
- Fees
- Function Call
- Contract Preparation
- Receipts
- Refunds
- Runtime
- Transactions
- Scenarios
Account Receipt Storage
There is a definition of all the keys and values we store in the Account Storage
Received data
key = receiver_id: String,data_id: CryptoHash
value = Option<Vec<u8>>
Runtime saves incoming data from DataReceipt until every input_data_ids in postponed receipt ActionReceipt for receiver_id account is satisfied.
Postponed receipts
For each awaited DataReceipt we store
key = receiver_id,data_id
value = receipt_id
Runtime saves incoming ActionReceipt until all required DataReceipt items for the same receiver_id have been received and matched, so that the postponed receipt_id receipt can be executed once its data dependencies are fully satisfied. See the Receipt Case for more details.
Actions
There are a several action types in Near:
#![allow(unused)]
fn main() {
pub enum Action {
    CreateAccount(CreateAccountAction),
    DeployContract(DeployContractAction),
    FunctionCall(FunctionCallAction),
    Transfer(TransferAction),
    Stake(StakeAction),
    AddKey(AddKeyAction),
    DeleteKey(DeleteKeyAction),
    DeleteAccount(DeleteAccountAction),
    Delegate(SignedDelegateAction),
    DeployGlobalContract(DeployGlobalContractAction),
    UseGlobalContract(UseGlobalContractAction),
    DeterministicStateInit(DeterministicStateInitAction),
}
}
Each transaction consists a list of actions to be performed on the receiver_id side. Since transactions are first
converted to receipts when they are processed, we will mostly concern ourselves with actions in the context of receipt
processing.
For the following actions, predecessor_id and receiver_id are required to be equal:
DeployContractStakeAddKeyDeleteKeyDeleteAccount
NOTE: if the first action in the action list is CreateAccount, predecessor_id becomes receiver_id
for the rest of the actions until DeleteAccount. This gives permission by another account to act on the newly created account.
CreateAccountAction
#![allow(unused)]
fn main() {
pub struct CreateAccountAction {}
}
If receiver_id has length == 64, this account id is considered to be hex(public_key), meaning creation of account only succeeds if followed up with AddKey(public_key) action.
Outcome:
- creates an account with
id=receiver_id - sets Account
storage_usagetoaccount_cost(genesis config)
Errors
Execution Error:
- If the action tries to create a top level account whose length is no greater than 32 characters, and
predecessor_idis notregistrar_account_id, which is defined by the protocol, the following error will be returned
#![allow(unused)]
fn main() {
/// A top-level account ID can only be created by registrar.
CreateAccountOnlyByRegistrar {
    account_id: AccountId,
    registrar_account_id: AccountId,
    predecessor_id: AccountId,
}
}
- If the action tries to create an account that is neither a top-level account or a subaccount of
predecessor_id, the following error will be returned
#![allow(unused)]
fn main() {
/// A newly created account must be under a namespace of the creator account
CreateAccountNotAllowed { account_id: AccountId, predecessor_id: AccountId },
}
DeployContractAction
#![allow(unused)]
fn main() {
pub struct DeployContractAction {
    pub code: Vec<u8>
}
}
Outcome:
- sets the contract code for account
Errors
Validation Error:
- if the length of
codeexceedsmax_contract_size, which is a genesis parameter, the following error will be returned:
#![allow(unused)]
fn main() {
/// The size of the contract code exceeded the limit in a DeployContract action.
ContractSizeExceeded { size: u64, limit: u64 },
}
Execution Error:
- If state or storage is corrupted, it may return
StorageError.
FunctionCallAction
#![allow(unused)]
fn main() {
pub struct FunctionCallAction {
    /// Name of exported Wasm function
    pub method_name: String,
    /// Serialized arguments
    pub args: Vec<u8>,
    /// Prepaid gas (gas_limit) for a function call
    pub gas: Gas,
    /// Amount of tokens to transfer to a receiver_id
    pub deposit: Balance,
}
}
Calls a method of a particular contract. See details.
TransferAction
#![allow(unused)]
fn main() {
pub struct TransferAction {
    /// Amount of tokens to transfer to a receiver_id
    pub deposit: Balance,
}
}
Outcome:
- transfers amount specified in
depositfrompredecessor_idto areceiver_idaccount
Errors
Execution Error:
- If the deposit amount plus the existing amount on the receiver account exceeds
u128::MAX, aStorageInconsistentState("Account balance integer overflow")error will be returned.
StakeAction
#![allow(unused)]
fn main() {
pub struct StakeAction {
    // Amount of tokens to stake
    pub stake: Balance,
    // This public key is a public key of the validator node
    pub public_key: PublicKey,
}
}
Outcome:
- A validator proposal that contains the staking public key and the staking amount is generated and will be included in the next block.
Errors
Validation Error:
- If the
public_keyis not an ristretto compatible ed25519 key, the following error will be returned:
#![allow(unused)]
fn main() {
/// An attempt to stake with a public key that is not convertible to ristretto.
UnsuitableStakingKey { public_key: PublicKey },
}
Execution Error:
- If an account has not staked but it tries to unstake, the following error will be returned:
#![allow(unused)]
fn main() {
/// Account is not yet staked, but tries to unstake
TriesToUnstake { account_id: AccountId },
}
- If an account tries to stake more than the amount of tokens it has, the following error will be returned:
#![allow(unused)]
fn main() {
/// The account doesn't have enough balance to increase the stake.
TriesToStake {
    account_id: AccountId,
    stake: Balance,
    locked: Balance,
    balance: Balance,
}
}
- If the staked amount is below the minimum stake threshold, the following error will be returned:
#![allow(unused)]
fn main() {
InsufficientStake {
    account_id: AccountId,
    stake: Balance,
    minimum_stake: Balance,
}
}
The minimum stake is determined by last_epoch_seat_price / minimum_stake_divisor where last_epoch_seat_price is the
seat price determined at the end of last epoch and minimum_stake_divisor is a genesis config parameter and its current
value is 10.
AddKeyAction
#![allow(unused)]
fn main() {
pub struct AddKeyAction {
    pub public_key: PublicKey,
    pub access_key: AccessKey,
}
}
Outcome:
- Adds a new AccessKey to the receiver's account and associates it with a
public_keyprovided.
Errors
Validation Error:
If the access key is of type FunctionCallPermission, the following errors can happen
- If
receiver_idinaccess_keyis not a valid account id, the following error will be returned
#![allow(unused)]
fn main() {
/// Invalid account ID.
InvalidAccountId { account_id: AccountId },
}
- If the length of some method name exceed
max_length_method_name, which is a genesis parameter (current value is 256), the following error will be returned
#![allow(unused)]
fn main() {
/// The length of some method name exceeded the limit in a Add Key action.
AddKeyMethodNameLengthExceeded { length: u64, limit: u64 },
}
- If the sum of length of method names (with 1 extra character for every method name) exceeds
max_number_bytes_method_names, which is a genesis parameter (current value is 2000), the following error will be returned
#![allow(unused)]
fn main() {
/// The total number of bytes of the method names exceeded the limit in a Add Key action.
AddKeyMethodNamesNumberOfBytesExceeded { total_number_of_bytes: u64, limit: u64 }
}
Execution Error:
- If an account tries to add an access key with a given public key, but an existing access key with this public key already exists, the following error will be returned
#![allow(unused)]
fn main() {
/// The public key is already used for an existing access key
AddKeyAlreadyExists { account_id: AccountId, public_key: PublicKey }
}
- If state or storage is corrupted, a
StorageErrorwill be returned.
DeleteKeyAction
#![allow(unused)]
fn main() {
pub struct DeleteKeyAction {
    pub public_key: PublicKey,
}
}
Outcome:
- Deletes the AccessKey associated with
public_key.
Errors
Execution Error:
- When an account tries to delete an access key that doesn't exist, the following error is returned
#![allow(unused)]
fn main() {
/// Account tries to remove an access key that doesn't exist
DeleteKeyDoesNotExist { account_id: AccountId, public_key: PublicKey }
}
StorageErroris returned if state or storage is corrupted.
DeleteAccountAction
#![allow(unused)]
fn main() {
pub struct DeleteAccountAction {
    /// The remaining account balance will be transferred to the AccountId below
    pub beneficiary_id: AccountId,
}
}
Outcomes:
- The account, as well as all the data stored under the account, is deleted and the tokens are transferred to
beneficiary_id.
Errors
Validation Error:
- If
beneficiary_idis not a valid account id, the following error will be returned
#![allow(unused)]
fn main() {
/// Invalid account ID.
InvalidAccountId { account_id: AccountId },
}
- If this action is not the last action in the action list of a receipt, the following error will be returned
#![allow(unused)]
fn main() {
/// The delete action must be a final action in transaction
DeleteActionMustBeFinal
}
- If the account still has locked balance due to staking, the following error will be returned
#![allow(unused)]
fn main() {
/// Account is staking and can not be deleted
DeleteAccountStaking { account_id: AccountId }
}
Execution Error:
- If state or storage is corrupted, a
StorageErroris returned.
Delegate Actions
Introduced with NEP-366 to enable meta transactions.
In summary, a delegate action is an indirect submission of a transaction. It allows a relayer to do the payment (gas and token costs) for a transaction authored by a user.
#![allow(unused)]
fn main() {
/// The struct contained in transactions and receipts, inside `Action::Delegate(_)``.
struct SignedDelegateAction {
    /// The actual action, see below.
    pub delegate_action: DelegateAction,
    /// NEP-483 proposal compliant signature
    pub signature: Signature,
}
}
Note that the signature follows a scheme which is proposed to be standardized in NEP-483.
#![allow(unused)]
fn main() {
/// The struct a user creates and signs to create a meta transaction.
struct DelegateAction {
    /// Signer of the delegated actions
    pub sender_id: AccountId,
    /// Receiver of the delegated actions.
    pub receiver_id: AccountId,
    /// List of actions to be executed.
    ///
    /// With the meta transactions MVP defined in NEP-366, nested
    /// DelegateActions are not allowed. A separate type is used to enforce it.
    pub actions: Vec<NonDelegateAction>,
    /// Nonce to ensure that the same delegate action is not sent twice by a
    /// relayer and should match for given account's `public_key`.
    /// After this action is processed it will increment.
    pub nonce: Nonce,
    /// The maximal height of the block in the blockchain below which the given DelegateAction is valid.
    pub max_block_height: BlockHeight,
    /// Public key used to sign this delegated action.
    pub public_key: PublicKey,
}
}
Outcomes
- All actions inside
delegate_action.actionsare submitted with thedelegate_action.sender_idas the predecessor,delegate_action.receiver_idas the receiver, and the relayer (predecessor ofDelegateAction) as the signer. - All gas and balance costs for submitting
delegate_action.actionsare subtracted from the relayer.
Errors
Validation Error:
- If the list of Transaction actions contains several
DelegateAction
#![allow(unused)]
fn main() {
/// There should be the only one DelegateAction
DelegateActionMustBeOnlyOne
}
Execution Error:
- If the Sender's account doesn't exist
#![allow(unused)]
fn main() {
/// Happens when TX receiver_id doesn't exist
AccountDoesNotExist
}
- If the
signaturedoes not match the data and thepublic_keyof the given key, then the following error will be returned
#![allow(unused)]
fn main() {
/// Signature does not match the provided actions and given signer public key.
DelegateActionInvalidSignature
}
- If the
sender_iddoesn't match thetx.receiver_id
#![allow(unused)]
fn main() {
/// Receiver of the transaction doesn't match Sender of the delegate action
DelegateActionSenderDoesNotMatchTxReceiver
}
- If the current block is equal or greater than
max_block_height
#![allow(unused)]
fn main() {
/// Delegate action has expired
DelegateActionExpired
}
- If the
public_keydoes not exist for Sender account
#![allow(unused)]
fn main() {
/// The given public key doesn't exist for Sender account
DelegateActionAccessKeyError
}
- If the
noncedoes match thepublic_keyfor thesender_id
#![allow(unused)]
fn main() {
/// Nonce must be greater sender[public_key].nonce
DelegateActionInvalidNonce
}
- If
nonceis too large
#![allow(unused)]
fn main() {
/// DelegateAction nonce is larger than the upper bound given by the block height (block_height * 1e6)
DelegateActionNonceTooLarge
}
DeployGlobalContractAction
#![allow(unused)]
fn main() {
pub struct DeployGlobalContractAction {
    /// WebAssembly binary
    pub code: Vec<u8>,
    /// How this global contract should be referenced
    pub deploy_mode: GlobalContractDeployMode,
}

pub enum GlobalContractDeployMode {
    /// Contract is deployed under its code hash.
    /// Users will be able reference it by that hash.
    /// This effectively makes the contract immutable.
    CodeHash,
    /// Contract is deployed under the owner account id.
    /// Users will be able reference it by that account id.
    /// This allows the owner to update the contract for all its users.
    AccountId,
}
}
Outcome:
- First, the provided code is made available as global contract on the current shard.
- The same code propagates globally, shard by shard.
- Eventually, all accounts on all shards can reference the submitted code by the corresponding global contract identifier.
Errors
Validation Error:
ContractSizeExceededif the provided WebAssembly code is larger thanmax_contract_size(4MiB).
Execution Error:
LackBalanceForStateif the account does not hold enough NEAR to cover the added storage.
UseGlobalContractAction
#![allow(unused)]
fn main() {
pub struct UseGlobalContractAction {
    /// References a deployed global contract to use in the receiver account.
    pub contract_identifier: GlobalContractIdentifier,
}
}
Outcome:
Errors
Validation Error:
InvalidAccountIdif the provided account id does not follow the AccountId specification.
Execution Error:
GlobalContractDoesNotExistif the referenced global contract does not exist on the shard of the receiver. (It may take a while for it to propagate to all shards.)
DeterministicStateInitAction
#![allow(unused)]
fn main() {
pub struct DeterministicStateInitAction {
    /// The data required to initialize the account.
    pub state_init: DeterministicAccountStateInit,
    /// A NEAR balance to cover storage requirements. Extra balance is refunded.
    pub deposit: Balance,
}
}
Outcome:
- if the account was already created before:
- do nothing
- if the account was not created before:
- creates an account with deterministic account id
- sets the contract code to the specified global contract
- stores the initial data into the contract storage
Errors
Validation Error:
InvalidDeterministicStateInitReceiverif the receiver id is not derived from the providedDeterministicAccountStateInitDeterministicStateInitKeyLengthExceededif any data key is longer thanmax_length_storage_key(4MiB)DeterministicStateInitValueLengthExceededif any data value is longer thanmax_length_storage_value(4MiB)
Execution Error:
GlobalContractDoesNotExistif the referenced global contract does not exist on the shard of the receiver. (It may take a while for it to propagate to all shards.)
Applying chunk
Inputs and outputs
Runtime.apply takes following inputs:
- trie and current state root
- validator_accounts_update
- incoming_receipts
- transactions
and produces following outputs:
- new state root
- validator_proposals
- outgoing_receipts
- (executed receipt) outcomes
- proof
Processing order
- If this is first block of an epoch, dispense epoch rewards to validators (in order of validator_accounts_update.stake_info)
- Slash locked balance for malicious behavior (in order of validator_accounts_update.slashing_info)
- If treasury account was not one of validators and this is first block of an epoch, dispense treasury account reward
- If this is first block of new version or first block with chunk of new version, apply corresponding migrations
- If this block do not have chunk for this shard, end process early
- Process transactions (in order of transactions)
- Process local receipts (in order of transactions that generated them)
- Process delayed receipts (ordered first by block where they were generated, then first local receipts based on order of generating transactions, then incoming receipts, ordered by incoming_receipts order)
- Process incoming receipts (ordered by incoming_receipts)
When processing receipts we track gas used (including gas used on migrations). If we use up gas limit, we finish processing the last receipt and stop to process delayed receipts, and for local and incoming receipts we add them to delayed receipts.
- If any of the delayed receipts were processed or any new receipts were delayed, update indices of first and last unprocessed receipts in state
- Remove duplicate validator proposals (for each account we only keep last one in receipts processing order)
Please note that local receipts are receipts generated by transaction where receiver is the same as signer of the transaction
Delayed receipts
In each block we have maximal amount of Gas we can use to process receipts and migrations, currently 1000 TGas. If any incoming or local receipts are not processed due to lack of remaining Gas, they are stored in state with key
TrieKey::DelayedReceipt { id } where id is unique index for each shard, assigned consecutively. Currently sender does not need to stake any tokens to store delayed receipts. State also contains special key TrieKey::DelayedReceiptIndiceswhere first and last ids of delayed receipts not yet processed are stored.
Components
Here is the high-level diagram of various runtime components, including some blockchain layer components.

Runtime crate
Runtime crate encapsulates the logic of how transactions and receipts should be handled. If it encounters
a smart contract call within a transaction or a receipt it calls near-vm-runner, for all other actions, like account
creation, it processes them in-place.
Runtime class
The main entry point of the Runtime is method apply.
It applies new singed transactions and incoming receipts for some chunk/shard on top of
given trie and the given state root.
If the validator accounts update is provided, updates validators accounts.
All new signed transactions should be valid and already verified by the chunk producer.
If any transaction is invalid, the method returns an InvalidTxError.
In case of success, the method returns ApplyResult that contains the new state root, trie changes,
new outgoing receipts, stats for validators (e.g. total rent paid by all the affected accounts),
execution outcomes.
Apply arguments
It takes the following arguments:
trie: Arc<Trie>- the trie that contains the latest state.root: CryptoHash- the hash of the state root in the trie.validator_accounts_update: &Option<ValidatorAccountsUpdate>- optional field that contains updates for validator accounts. It's provided at the beginning of the epoch or when someone is slashed.apply_state: &ApplyState- contains block index and timestamp, epoch length, gas price and gas limit.prev_receipts: &[Receipt]- the list of incoming receipts, from the previous block.transactions: &[SignedTransaction]- the list of new signed transactions.
Apply logic
The execution consists of the following stages:
- Snapshot the initial state.
- Apply validator accounts update, if available.
- Convert new signed transactions into the receipts.
- Process receipts.
- Check that incoming and outgoing balances match.
- Finalize trie update.
- Return
ApplyResult.
Validator accounts update
Validator accounts are accounts that staked some tokens to become a validator. The validator accounts update usually happens when the current chunk is the first chunk of the epoch. It also happens when there is a challenge in the current block with one of the participants belong to the current shard.
This update distributes validator rewards, return locked tokens and maybe slashes some accounts out of their stake.
Signed Transaction conversion
New signed transaction transactions are provided by the chunk producer in the chunk. These transactions should be ordered and already validated. Runtime does validation again for the following reasons:
- to charge accounts for transactions fees, transfer balances, prepaid gas and account rents;
- to create new receipts;
- to compute burnt gas;
- to validate transactions again, in case the chunk producer was malicious.
If the transaction has the same signer_id and receiver_id, then the new receipt is added to the list of new local receipts,
otherwise it's added to the list of new outgoing receipts.
Receipt processing
Receipts are processed one by one in the following order:
- Previously delayed receipts from the state.
- New local receipts.
- New incoming receipts.
After each processed receipt, we compare total gas burnt (so far) with the gas limit. When the total gas burnt reaches or exceeds the gas limit, the processing stops. The remaining receipts are considered delayed and stored into the state.
Delayed receipts
Delayed receipts are stored as a persistent queue in the state. Initially, the first unprocessed index and the next available index are initialized to 0. When a new delayed receipt is added, it's written under the next available index in to the state and the next available index is incremented by 1. When a delayed receipt is processed, it's read from the state using the first unprocessed index and the first unprocessed index is incremented. At the end of the receipt processing, the all remaining local and incoming receipts are considered to be delayed and stored to the state in their respective order. If during receipt processing, we've changed indices, then the delayed receipt indices are stored to the state as well.
Receipt processing algorithm
The receipt processing algorithm is the following:
- Read indices from the state or initialize with zeros.
- While the first unprocessed index is less than the next available index do the following
- If the total burnt gas is at least the gas limit, break.
- Read the receipt from the first unprocessed index.
- Remove the receipt from the state.
- Increment the first unprocessed index.
- Process the receipt.
- Add the new burnt gas to the total burnt gas.
- Remember that the delayed queue indices has changed.
- Process the new local receipts and then the new incoming receipts
- If the total burnt gas is less then the gas limit:
- Process the receipt.
- Add the new burnt gas to the total burnt gas.
- Else:
- Store the receipt under the next available index.
- Increment the next available index.
- Remember that the delayed queue indices has changed.
- If the total burnt gas is less then the gas limit:
- If the delayed queue indices has changed, store the new indices to the state.
Balance checker
Balance checker computes the total incoming balance and the total outgoing balance.
The total incoming balance consists of the following:
- Incoming validator rewards from validator accounts update.
- Sum of the initial accounts balances for all affected accounts. We compute it using the snapshot of the initial state.
- Incoming receipts balances. The prepaid fees and gas multiplied their gas prices with the attached balances from transfers and function calls. Refunds are considered to be free of charge for fees, but still has attached deposits.
- Balances for the processed delayed receipts.
- Initial balances for the postponed receipts. Postponed receipts are receipts from the previous blocks that were processed, but were not executed. They are action receipts with some expected incoming data. Usually for a callback on top of awaited promise. When the expected data arrives later than the action receipt, then the action receipt is postponed. Note, the data receipts are 0 cost, because they are completely prepaid when issued.
The total outgoing balance consists of the following:
- Sum of the final accounts balance for all affected accounts.
- Outgoing receipts balances.
- New delayed receipts. Local and incoming receipts that were not processed this time.
- Final balances for the postponed receipts.
- Total rent paid by all affected accounts.
- Total new validator rewards. It's computed from total gas burnt rewards.
- Total balance burnt. In case the balance is burnt for some reason (e.g. account was deleted during the refund), it's accounted there.
- Total balance slashed. In case a validator is slashed for some reason, the balance is account here.
When you sum up incoming balances and outgoing balances, they should match. If they don't match, we throw an error.
Bindings Specification
This is the low-level interface available to the smart contracts, it consists of the functions that the host (represented by Wasmer inside near-vm-runner) exposes to the guest (the smart contract compiled to Wasm).
Due to Wasm restrictions the methods operate only with primitive types, like u64.
Also for all functions in the bindings specification the following is true:
- Method execution could result in
MemoryAccessViolationerror if one of the following happens:- The method causes host to read a piece of memory from the guest but it points outside the guest's memory;
- The guest causes host to read from the register, but register id is invalid.
Execution of a bindings function call result in an error being generated. This error causes execution of the smart contract to be terminated and the error message written into the logs of the transaction that caused the execution. Many bindings functions can throw specialized error messages, but there is also a list of error messages that can be thrown by almost any function:
IntegerOverflow-- happens when guest passes some data to the host but when host tries to apply arithmetic operation on it it causes overflow or underflow;GasExceeded-- happens when operation performed by the guest causes more gas than the remaining prepaid gas;GasLimitExceeded-- happens when the execution uses more gas than allowed by the global limit imposed in the economics config;StorageError-- happens when method fails to do some operation on the trie.
The following binding methods cannot be invoked in a view call:
signer_account_idsigner_account_pkpredecessor_account_idattached_depositprepaid_gasused_gaspromise_createpromise_thenpromise_andpromise_batch_createpromise_batch_thenpromise_batch_action_create_accountpromise_batch_action_deploy_accountpromise_batch_action_function_callpromise_batch_action_transferpromise_batch_action_stakepromise_batch_action_add_key_with_full_accesspromise_batch_action_add_key_with_function_callpromise_batch_action_delete_keypromise_batch_action_delete_accountpromise_results_countpromise_resultpromise_return
If they are invoked the smart contract execution will panic with ProhibitedInView(<method name>).
Context API
Context API mostly provides read-only functions that access current information about the blockchain, the accounts (that originally initiated the chain of cross-contract calls, the immediate contract that called the current one, the account of the current contract), other important information like storage usage.
Many of the below functions are currently implemented through data_read which allows to read generic context data.
However, there is no reason to have data_read instead of the specific functions:
data_readdoes not solve forward compatibility. If later we want to add another context function, e.g.executed_operationswe can just declare it as a new function, instead of encoding it asDATA_TYPE_EXECUTED_OPERATIONS = 42which is passed as the first argument todata_read;data_readdoes not help with renaming. If later we decide to renamesigner_account_idtooriginator_idthen one could argue that contracts that rely ondata_readwould not break, while contracts relying onsigner_account_id()would. However the name change often means the change of the semantics, which means the contracts using this function are no longer safe to execute anyway.
However there is one reason to not have data_read -- it makes API more human-like which is a general direction Wasm APIs, like WASI are moving towards to.
#![allow(unused)]
fn main() {
current_account_id(register_id: u64)
}
Saves the account id of the current contract that we execute into the register.
Panics
- If the registers exceed the memory limit panics with
MemoryAccessViolation;
signer_account_id
#![allow(unused)]
fn main() {
signer_account_id(register_id: u64)
}
All contract calls are a result of some transaction that was signed by some account using some access key and submitted into a memory pool (either through the wallet using RPC or by a node itself). This function returns the id of that account.
Normal operation
- Saves the bytes of the signer account id into the register.
Panics
- If the registers exceed the memory limit panics with
MemoryAccessViolation; - If called in a view function panics with
ProhibitedInView.
Current bugs
- Currently we conflate
originator_idandsender_idin our code base.
signer_account_pk
#![allow(unused)]
fn main() {
signer_account_pk(register_id: u64)
}
Saves the public key fo the access key that was used by the signer into the register. In rare situations smart contract might want to know the exact access key that was used to send the original transaction, e.g. to increase the allowance or manipulate with the public key.
Panics
- If the registers exceed the memory limit panics with
MemoryAccessViolation; - If called in a view function panics with
ProhibitedInView.
Current bugs
- Not implemented.
predecessor_account_id
#![allow(unused)]
fn main() {
predecessor_account_id(register_id: u64)
}
All contract calls are a result of a receipt, this receipt might be created by a transaction that does function invocation on the contract or another contract as a result of cross-contract call.
Normal operation
- Saves the bytes of the predecessor account id into the register.
Panics
- If the registers exceed the memory limit panics with
MemoryAccessViolation; - If called in a view function panics with
ProhibitedInView.
Current bugs
- Not implemented.
refund_to_account_id
#![allow(unused)]
fn main() {
refund_to_account_id(register_id: u64)
}
If a receipt fails execution, a balance refund usually goes to the predecessor of the receipt. However, the predecessor can set this to another account id when sending the receipt.
Normal operation
- Saves the bytes of the account id receiving balance refunds into the register.
Panics
- If the registers exceed the memory limit panics with
MemoryAccessViolation; - If called in a view function panics with
ProhibitedInView.
Current bugs
- Not implemented.
input
#![allow(unused)]
fn main() {
input(register_id: u64)
}
Reads input to the contract call into the register. Input is expected to be in JSON-format.
Normal operation
- If input is provided saves the bytes (potentially zero) of input into register.
- If input is not provided does not modify the register.
Returns
- If input was not provided returns
0; - If input was provided returns
1; If input is zero bytes returns1, too.
Panics
- If the registers exceed the memory limit panics with
MemoryAccessViolation;
Current bugs
- Implemented as part of
data_read. However there is no reason to have one unified function, likedata_readthat can be used to read all
#![allow(unused)]
fn main() {
block_index() -> u64
}
Returns the current block height from genesis.
#![allow(unused)]
fn main() {
block_timestamp() -> u64
}
Returns the current block timestamp (number of non-leap-nanoseconds since January 1, 1970 0:00:00 UTC).
#![allow(unused)]
fn main() {
epoch_height() -> u64
}
Returns the current epoch height from genesis.
#![allow(unused)]
fn main() {
storage_usage() -> u64
}
Returns the number of bytes used by the contract if it was saved to the trie as of the invocation. This includes:
- The data written with
storage_*functions during current and previous execution; - The bytes needed to store the account protobuf and the access keys of the given account.
Economics API
Accounts own certain balance; and each transaction and each receipt have certain amount of balance and prepaid gas
attached to them.
During the contract execution, the contract has access to the following u128 values:
account_balance-- the balance attached to the given account. This includes theattached_depositthat was attached to the transaction;attached_deposit-- the balance that was attached to the call that will be immediately deposited before the contract execution starts;prepaid_gas-- the tokens attached to the call that can be used to pay for the gas;used_gas-- the gas that was already burnt during the contract execution and attached to promises (cannot exceedprepaid_gas);
If contract execution fails prepaid_gas - used_gas is refunded back to signer_account_id and attached_deposit
is refunded back to predecessor_account_id.
The following spec is the same for all functions:
#![allow(unused)]
fn main() {
account_balance(balance_ptr: u64)
attached_deposit(balance_ptr: u64)

}
-- writes the value into the u128 variable pointed by balance_ptr.
Panics
- If
balance_ptr + 16points outside the memory of the guest withMemoryAccessViolation; - If called in a view function panics with
ProhibitedInView.
Current bugs
- Use a different name;
#![allow(unused)]
fn main() {
prepaid_gas() -> u64
used_gas() -> u64
}
Panics
- If called in a view function panics with
ProhibitedInView.
Math API
random_seed
#![allow(unused)]
fn main() {
random_seed(register_id: u64)
}
Returns random seed that can be used for pseudo-random number generation in deterministic way.
Panics
- If the size of the registers exceed the set limit
MemoryAccessViolation;
sha256
#![allow(unused)]
fn main() {
sha256(value_len: u64, value_ptr: u64, register_id: u64)
}
Hashes the random sequence of bytes using sha256 and returns it into register_id.
Panics
- If
value_len + value_ptrpoints outside the memory or the registers use more memory than the limit withMemoryAccessViolation.
keccak256
#![allow(unused)]
fn main() {
keccak256(value_len: u64, value_ptr: u64, register_id: u64)
}
Hashes the random sequence of bytes using keccak256 and returns it into register_id.
Panics
- If
value_len + value_ptrpoints outside the memory or the registers use more memory than the limit withMemoryAccessViolation.
keccak512
#![allow(unused)]
fn main() {
keccak512(value_len: u64, value_ptr: u64, register_id: u64)
}
Hashes the random sequence of bytes using keccak512 and returns it into register_id.
Panics
- If
value_len + value_ptrpoints outside the memory or the registers use more memory than the limit withMemoryAccessViolation.
Miscellaneous API
#![allow(unused)]
fn main() {
value_return(value_len: u64, value_ptr: u64)
}
Sets the blob of data as the return value of the contract.
Panics
- If
value_len + value_ptrexceeds the memory container or points to an unused register it panics withMemoryAccessViolation;
#![allow(unused)]
fn main() {
panic()
}
Terminates the execution of the program with panic GuestPanic("explicit guest panic").
panic_utf8
#![allow(unused)]
fn main() {
panic_utf8(len: u64, ptr: u64)
}
Terminates the execution of the program with panic GuestPanic(s), where s is the given UTF-8 encoded string.
Normal behavior
If len == u64::MAX then treats the string as null-terminated with character '\0';
Panics
- If string extends outside the memory of the guest with
MemoryAccessViolation; - If string is not UTF-8 returns
BadUtf8. - If string length without null-termination symbol is larger than
config.max_log_lenreturnsBadUtf8.
log_utf8
#![allow(unused)]
fn main() {
log_utf8(len: u64, ptr: u64)
}
Logs the UTF-8 encoded string.
Normal behavior
If len == u64::MAX then treats the string as null-terminated with character '\0';
Panics
- If string extends outside the memory of the guest with
MemoryAccessViolation; - If string is not UTF-8 returns
BadUtf8. - If string length without null-termination symbol is larger than
config.max_log_lenreturnsBadUtf8.
log_utf16
#![allow(unused)]
fn main() {
log_utf16(len: u64, ptr: u64)
}
Logs the UTF-16 encoded string. len is the number of bytes in the string.
See https://stackoverflow.com/a/5923961 that explains that null termination is not defined through encoding.
Normal behavior
If len == u64::MAX then treats the string as null-terminated with two-byte sequence of 0x00 0x00.
Panics
- If string extends outside the memory of the guest with
MemoryAccessViolation;
abort
#![allow(unused)]
fn main() {
abort(msg_ptr: u32, filename_ptr: u32, line: u32, col: u32)
}
Special import kept for compatibility with AssemblyScript contracts. Not called by smart contracts directly, but instead called by the code generated by AssemblyScript.
Future Improvements
In the future we can have some of the registers to be on the guest. For instance a guest can tell the host that it has some pre-allocated memory that it wants to be used for the register, e.g.
set_guest_register
#![allow(unused)]
fn main() {
set_guest_register(register_id: u64, register_ptr: u64, max_register_size: u64)
}
will assign register_id to a span of memory on the guest. Host then would also know the size of that buffer on guest
and can throw a panic if there is an attempted copying that exceeds the guest register size.
Promises API
promise_create
#![allow(unused)]
fn main() {
promise_create(account_id_len: u64,
               account_id_ptr: u64,
               method_name_len: u64,
               method_name_ptr: u64,
               arguments_len: u64,
               arguments_ptr: u64,
               amount_ptr: u64,
               gas: u64) -> u64
}
Creates a promise that will execute a method on account with given arguments and attaches the given amount.
amount_ptr point to slices of bytes representing u128.
Panics
- If
account_id_len + account_id_ptrormethod_name_len + method_name_ptrorarguments_len + arguments_ptroramount_ptr + 16points outside the memory of the guest or host, withMemoryAccessViolation. - If called in a view function panics with
ProhibitedInView.
Returns
- Index of the new promise that uniquely identifies it within the current execution of the method.
promise_then
#![allow(unused)]
fn main() {
promise_then(promise_idx: u64,
             account_id_len: u64,
             account_id_ptr: u64,
             method_name_len: u64,
             method_name_ptr: u64,
             arguments_len: u64,
             arguments_ptr: u64,
             amount_ptr: u64,
             gas: u64) -> u64
}
Attaches the callback that is executed after promise pointed by promise_idx is complete.
Panics
- If
promise_idxdoes not correspond to an existing promise panics withInvalidPromiseIndex. - If
account_id_len + account_id_ptrormethod_name_len + method_name_ptrorarguments_len + arguments_ptroramount_ptr + 16points outside the memory of the guest or host, withMemoryAccessViolation. - If called in a view function panics with
ProhibitedInView.
Returns
- Index of the new promise that uniquely identifies it within the current execution of the method.
promise_and
#![allow(unused)]
fn main() {
promise_and(promise_idx_ptr: u64, promise_idx_count: u64) -> u64
}
Creates a new promise which completes when time all promises passed as arguments complete. Cannot be used with registers.
promise_idx_ptr points to an array of u64 elements, with promise_idx_count denoting the number of elements.
The array contains indices of promises that need to be waited on jointly.
Panics
- If
promise_ids_ptr + 8 * promise_idx_countextend outside the guest memory withMemoryAccessViolation; - If any of the promises in the array do not correspond to existing promises panics with
InvalidPromiseIndex. - If called in a view function panics with
ProhibitedInView.
Returns
- Index of the new promise that uniquely identifies it within the current execution of the method.
promise_results_count
#![allow(unused)]
fn main() {
promise_results_count() -> u64
}
If the current function is invoked by a callback we can access the execution results of the promises that caused the callback. This function returns the number of complete and incomplete callbacks.
Note, we are only going to have incomplete callbacks once we have promise_or combinator.
Normal execution
- If there is only one callback
promise_results_count()returns1; - If there are multiple callbacks (e.g. created through
promise_and)promise_results_count()returns their number. - If the function was called not through the callback
promise_results_count()returns0.
Panics
- If called in a view function panics with
ProhibitedInView.
promise_result
#![allow(unused)]
fn main() {
promise_result(result_idx: u64, register_id: u64) -> u64
}
If the current function is invoked by a callback we can access the execution results of the promises that caused the callback. This function returns the result in blob format and places it into the register.
Normal execution
- If promise result is complete and successful copies its blob into the register;
- If promise result is complete and failed or incomplete keeps register unused;
Returns
- If promise result is not complete returns
0; - If promise result is complete and successful returns
1; - If promise result is complete and failed returns
2.
Panics
- If
result_idxdoes not correspond to an existing result panics withInvalidResultIndex. - If copying the blob exhausts the memory limit it panics with
MemoryAccessViolation. - If called in a view function panics with
ProhibitedInView.
Current bugs
- We currently have two separate functions to check for result completion and copy it.
promise_return
#![allow(unused)]
fn main() {
promise_return(promise_idx: u64)
}
When promise promise_idx finishes executing its result is considered to be the result of the current function.
Panics
- If
promise_idxdoes not correspond to an existing promise panics withInvalidPromiseIndex.
Current bugs
- The current name
return_promiseis inconsistent with the naming convention of Promise API.
promise_batch_create
#![allow(unused)]
fn main() {
promise_batch_create(account_id_len: u64, account_id_ptr: u64) -> u64
}
Creates a new promise towards given account_id without any actions attached to it.
Panics
- If
account_id_len + account_id_ptrpoints outside the memory of the guest or host, withMemoryAccessViolation. - If called in a view function panics with
ProhibitedInView.
Returns
- Index of the new promise that uniquely identifies it within the current execution of the method.
promise_batch_then
#![allow(unused)]
fn main() {
promise_batch_then(promise_idx: u64, account_id_len: u64, account_id_ptr: u64) -> u64
}
Attaches a new empty promise that is executed after promise pointed by promise_idx is complete.
Panics
- If
promise_idxdoes not correspond to an existing promise panics withInvalidPromiseIndex. - If
account_id_len + account_id_ptrpoints outside the memory of the guest or host, withMemoryAccessViolation. - If called in a view function panics with
ProhibitedInView.
Returns
- Index of the new promise that uniquely identifies it within the current execution of the method.
promise_batch_action_create_account
#![allow(unused)]
fn main() {
promise_batch_action_create_account(promise_idx: u64)
}
Appends CreateAccount action to the batch of actions for the given promise pointed by promise_idx.
Details for the action: https://github.com/nearprotocol/NEPs/pull/8/files#diff-15b6752ec7d78e7b85b8c7de4a19cbd4R48
Panics
- If
promise_idxdoes not correspond to an existing promise panics withInvalidPromiseIndex. - If the promise pointed by the
promise_idxis an ephemeral promise created bypromise_and. - If called in a view function panics with
ProhibitedInView.
promise_batch_action_deploy_contract
#![allow(unused)]
fn main() {
promise_batch_action_deploy_contract(promise_idx: u64, code_len: u64, code_ptr: u64)
}
Appends DeployContract action to the batch of actions for the given promise pointed by promise_idx.
Details for the action: https://github.com/nearprotocol/NEPs/pull/8/files#diff-15b6752ec7d78e7b85b8c7de4a19cbd4R49
Panics
- If
promise_idxdoes not correspond to an existing promise panics withInvalidPromiseIndex. - If the promise pointed by the
promise_idxis an ephemeral promise created bypromise_and. - If
code_len + code_ptrpoints outside the memory of the guest or host, withMemoryAccessViolation. - If called in a view function panics with
ProhibitedInView.
promise_batch_action_function_call
#![allow(unused)]
fn main() {
promise_batch_action_function_call(promise_idx: u64,
                                   method_name_len: u64,
                                   method_name_ptr: u64,
                                   arguments_len: u64,
                                   arguments_ptr: u64,
                                   amount_ptr: u64,
                                   gas: u64)
}
Appends FunctionCall action to the batch of actions for the given promise pointed by promise_idx.
Details for the action: https://github.com/nearprotocol/NEPs/pull/8/files#diff-15b6752ec7d78e7b85b8c7de4a19cbd4R50
NOTE: Calling promise_batch_create and then promise_batch_action_function_call will produce the same promise as calling promise_create directly.
Panics
- If
promise_idxdoes not correspond to an existing promise panics withInvalidPromiseIndex. - If the promise pointed by the
promise_idxis an ephemeral promise created bypromise_and. - If
account_id_len + account_id_ptrormethod_name_len + method_name_ptrorarguments_len + arguments_ptroramount_ptr + 16points outside the memory of the guest or host, withMemoryAccessViolation. - If called in a view function panics with
ProhibitedInView.
promise_batch_action_transfer
#![allow(unused)]
fn main() {
promise_batch_action_transfer(promise_idx: u64, amount_ptr: u64)
}
Appends Transfer action to the batch of actions for the given promise pointed by promise_idx.
Details for the action: https://github.com/nearprotocol/NEPs/pull/8/files#diff-15b6752ec7d78e7b85b8c7de4a19cbd4R51
Panics
- If
promise_idxdoes not correspond to an existing promise panics withInvalidPromiseIndex. - If the promise pointed by the
promise_idxis an ephemeral promise created bypromise_and. - If
amount_ptr + 16points outside the memory of the guest or host, withMemoryAccessViolation. - If called in a view function panics with
ProhibitedInView.
promise_batch_action_stake
#![allow(unused)]
fn main() {
promise_batch_action_stake(promise_idx: u64,
                           amount_ptr: u64,
                           bls_public_key_len: u64,
                           bls_public_key_ptr: u64)
}
Appends Stake action to the batch of actions for the given promise pointed by promise_idx.
Details for the action: https://github.com/nearprotocol/NEPs/pull/8/files#diff-15b6752ec7d78e7b85b8c7de4a19cbd4R52
Panics
- If
promise_idxdoes not correspond to an existing promise panics withInvalidPromiseIndex. - If the promise pointed by the
promise_idxis an ephemeral promise created bypromise_and. - If the given BLS public key is not a valid BLS public key (e.g. wrong length)
InvalidPublicKey. - If
amount_ptr + 16orbls_public_key_len + bls_public_key_ptrpoints outside the memory of the guest or host, withMemoryAccessViolation. - If called in a view function panics with
ProhibitedInView.
promise_batch_action_add_key_with_full_access
#![allow(unused)]
fn main() {
promise_batch_action_add_key_with_full_access(promise_idx: u64,
                                              public_key_len: u64,
                                              public_key_ptr: u64,
                                              nonce: u64)
}
Appends AddKey action to the batch of actions for the given promise pointed by promise_idx.
Details for the action: https://github.com/nearprotocol/NEPs/pull/8/files#diff-15b6752ec7d78e7b85b8c7de4a19cbd4R54
The access key will have FullAccess permission, details: click here
Panics
- If
promise_idxdoes not correspond to an existing promise panics withInvalidPromiseIndex. - If the promise pointed by the
promise_idxis an ephemeral promise created bypromise_and. - If the given public key is not a valid public key (e.g. wrong length)
InvalidPublicKey. - If
public_key_len + public_key_ptrpoints outside the memory of the guest or host, withMemoryAccessViolation. - If called in a view function panics with
ProhibitedInView.
promise_batch_action_add_key_with_function_call
#![allow(unused)]
fn main() {
promise_batch_action_add_key_with_function_call(promise_idx: u64,
                                                public_key_len: u64,
                                                public_key_ptr: u64,
                                                nonce: u64,
                                                allowance_ptr: u64,
                                                receiver_id_len: u64,
                                                receiver_id_ptr: u64,
                                                method_names_len: u64,
                                                method_names_ptr: u64)
}
Appends AddKey action to the batch of actions for the given promise pointed by promise_idx.
Details for the action: https://github.com/nearprotocol/NEPs/pull/8/files#diff-156752ec7d78e7b85b8c7de4a19cbd4R54
The access key will have FunctionCall permission, details: click here
- If the
allowancevalue (not the pointer) is0, the allowance is set toNone(which means unlimited allowance). And positive value represents aSome(...)allowance. - Given
method_namesis autf-8string with,used as a separator. The vm will split the given string into a vector of strings.
Panics
- If
promise_idxdoes not correspond to an existing promise panics withInvalidPromiseIndex. - If the promise pointed by the
promise_idxis an ephemeral promise created bypromise_and. - If the given public key is not a valid public key (e.g. wrong length)
InvalidPublicKey. - if
method_namesis not a validutf-8string, fails withBadUTF8. - If
public_key_len + public_key_ptr,allowance_ptr + 16,receiver_id_len + receiver_id_ptrormethod_names_len + method_names_ptrpoints outside the memory of the guest or host, withMemoryAccessViolation. - If called in a view function panics with
ProhibitedInView.
promise_batch_action_delete_key
#![allow(unused)]
fn main() {
promise_batch_action_delete_key(promise_idx: u64,
                                public_key_len: u64,
                                public_key_ptr: u64)
}
Appends DeleteKey action to the batch of actions for the given promise pointed by promise_idx.
Details for the action: https://github.com/nearprotocol/NEPs/pull/8/files#diff-15b6752ec7d78e7b85b8c7de4a19cbd4R55
Panics
- If
promise_idxdoes not correspond to an existing promise panics withInvalidPromiseIndex. - If the promise pointed by the
promise_idxis an ephemeral promise created bypromise_and. - If the given public key is not a valid public key (e.g. wrong length)
InvalidPublicKey. - If
public_key_len + public_key_ptrpoints outside the memory of the guest or host, withMemoryAccessViolation. - If called in a view function panics with
ProhibitedInView.
promise_batch_action_delete_account
#![allow(unused)]
fn main() {
promise_batch_action_delete_account(promise_idx: u64,
                                    beneficiary_id_len: u64,
                                    beneficiary_id_ptr: u64)
}
Appends DeleteAccount action to the batch of actions for the given promise pointed by promise_idx.
Action is used to delete an account. It can be performed on a newly created account, on your own account or an account with
insufficient funds to pay rent. Takes beneficiary_id to indicate where to send the remaining funds.
Panics
- If
promise_idxdoes not correspond to an existing promise panics withInvalidPromiseIndex. - If the promise pointed by the
promise_idxis an ephemeral promise created bypromise_and. - If
beneficiary_id_len + beneficiary_id_ptrpoints outside the memory of the guest or host, withMemoryAccessViolation. - If called in a view function panics with
ProhibitedInView.
Registers API
Registers allow the host function to return the data into a buffer located inside the host oppose to the buffer located on the client. A special operation can be used to copy the content of the buffer into the host. Memory pointers can then be used to point either to the memory on the guest or the memory on the host, see below. Benefits:
- We can have functions that return values that are not necessarily used, e.g. inserting key-value into a trie can also return the preempted old value, which might not be necessarily used. Previously, if we returned something we would have to pass the blob from host into the guest, even if it is not used;
- We can pass blobs of data between host functions without going through the guest, e.g. we can remove the value from the storage and insert it into under a different key;
- It makes API cleaner, because we don't need to pass
buffer_lenandbuffer_ptras arguments to other functions; - It allows merging certain functions together, see
storage_iter_next; - This is consistent with other APIs that were created for high performance, e.g. allegedly Ewasm has implemented SNARK-like computations in Wasm by exposing a BigNum library through stack-like interface to the guest. The guest can manipulate then with the stack of 256-bit numbers that is located on the host.
Host → host blob passing
The registers can be used to pass the blobs between host functions. For any function that
takes a pair of arguments *_len: u64, *_ptr: u64 this pair is pointing to a region of memory either on the guest or
the host:
- If
*_len != u64::MAXit points to the memory on the guest; - If
*_len == u64::MAXit points to the memory under the register*_ptron the host.
For example:
storage_write(u64::MAX, 0, u64::MAX, 1, 2) -- insert key-value into storage, where key is read from register 0,
value is read from register 1, and result is saved to register 2.
Note, if some function takes register_id then it means this function can copy some data into this register. If
register_id == u64::MAX then the copying does not happen. This allows some micro-optimizations in the future.
Note, we allow multiple registers on the host, identified with u64 number. The guest does not have to use them in
order and can for instance save some blob in register 5000 and another value in register 1.
Specification
#![allow(unused)]
fn main() {
read_register(register_id: u64, ptr: u64)
}
Writes the entire content from the register register_id into the memory of the guest starting with ptr.
Panics
- If the content extends outside the memory allocated to the guest. In Wasmer, it returns
MemoryAccessViolationerror message; - If
register_idis pointing to unused register returnsInvalidRegisterIderror message.
Undefined Behavior
- If the content of register extends outside the preallocated memory on the host side, or the pointer points to a wrong location this function will overwrite memory that it is not supposed to overwrite causing an undefined behavior.
#![allow(unused)]
fn main() {
register_len(register_id: u64) -> u64
}
Returns the size of the blob stored in the given register.
Normal operation
- If register is used, then returns the size, which can potentially be zero;
- If register is not used, returns
u64::MAX
Trie API
Here we provide a specification of trie API. After this NEP is merged, the cases where our current implementation does not follow the specification are considered to be bugs that need to be fixed.
storage_write
#![allow(unused)]
fn main() {
storage_write(key_len: u64, key_ptr: u64, value_len: u64, value_ptr: u64, register_id: u64) -> u64
}
Writes key-value into storage.
Normal operation
- If key is not in use it inserts the key-value pair and does not modify the register;
- If key is in use it inserts the key-value and copies the old value into the
register_id.
Returns
- If key was not used returns
0; - If key was used returns
1.
Panics
- If
key_len + key_ptrorvalue_len + value_ptrexceeds the memory container or points to an unused register it panics withMemoryAccessViolation. (When we say that something panics with the given error we mean that we use Wasmer API to create this error and terminate the execution of VM. For mocks of the host that would only cause a non-name panic.) - If returning the preempted value into the registers exceed the memory container it panics with
MemoryAccessViolation;
Current bugs
External::storage_settrait can return an error which is then converted to a generic non-descriptiveStorageUpdateError, here however the actual implementation does not return error at all, see;- Does not return into the registers.
storage_read
#![allow(unused)]
fn main() {
storage_read(key_len: u64, key_ptr: u64, register_id: u64) -> u64
}
Reads the value stored under the given key.
Normal operation
- If key is used copies the content of the value into the
register_id, even if the content is zero bytes; - If key is not present then does not modify the register.
Returns
- If key was not present returns
0; - If key was present returns
1.
Panics
- If
key_len + key_ptrexceeds the memory container or points to an unused register it panics withMemoryAccessViolation; - If returning the preempted value into the registers exceed the memory container it panics with
MemoryAccessViolation;
Current bugs
- This function currently does not exist.
storage_remove
#![allow(unused)]
fn main() {
storage_remove(key_len: u64, key_ptr: u64, register_id: u64) -> u64
}
Removes the value stored under the given key.
Normal operation
Very similar to storage_read:
- If key is used, removes the key-value from the trie and copies the content of the value into the
register_id, even if the content is zero bytes. - If key is not present then does not modify the register.
Returns
- If key was not present returns
0; - If key was present returns
1.
Panics
- If
key_len + key_ptrexceeds the memory container or points to an unused register it panics withMemoryAccessViolation; - If the registers exceed the memory limit panics with
MemoryAccessViolation; - If returning the preempted value into the registers exceed the memory container it panics with
MemoryAccessViolation;
Current bugs
- Does not return into the registers.
storage_has_key
#![allow(unused)]
fn main() {
storage_has_key(key_len: u64, key_ptr: u64) -> u64
}
Checks if there is a key-value pair.
Normal operation
- If key is used returns
1, even if the value is zero bytes; - Otherwise returns
0.
Panics
- If
key_len + key_ptrexceeds the memory container it panics withMemoryAccessViolation;
storage_iter_prefix
#![allow(unused)]
fn main() {
storage_iter_prefix(prefix_len: u64, prefix_ptr: u64) -> u64
}
DEPRECATED, calling it will result in HostError::Deprecated error.
Creates an iterator object inside the host.
Returns the identifier that uniquely differentiates the given iterator from other iterators that can be simultaneously
created.
Normal operation
- It iterates over the keys that have the provided prefix. The order of iteration is defined by the lexicographic order of the bytes in the keys. If there are no keys, it creates an empty iterator, see below on empty iterators;
Panics
- If
prefix_len + prefix_ptrexceeds the memory container it panics withMemoryAccessViolation;
storage_iter_range
#![allow(unused)]
fn main() {
storage_iter_range(start_len: u64, start_ptr: u64, end_len: u64, end_ptr: u64) -> u64
}
DEPRECATED, calling it will result in HostError::Deprecated error.
Similarly to storage_iter_prefix
creates an iterator object inside the host.
Normal operation
Unless lexicographically start < end, it creates an empty iterator.
Iterates over all key-values such that keys are between start and end, where start is inclusive and end is exclusive.
Note, this definition allows for start or end keys to not actually exist on the given trie.
Panics
- If
start_len + start_ptrorend_len + end_ptrexceeds the memory container or points to an unused register it panics withMemoryAccessViolation;
storage_iter_next
#![allow(unused)]
fn main() {
storage_iter_next(iterator_id: u64, key_register_id: u64, value_register_id: u64) -> u64
}
DEPRECATED, calling it will result in HostError::Deprecated error.
Advances iterator and saves the next key and value in the register.
Normal operation
- If iterator is not empty (after calling next it points to a key-value), copies the key into
key_register_idand value intovalue_register_idand returns1; - If iterator is empty returns
0.
This allows us to iterate over the keys that have zero bytes stored in values.
Panics
- If
key_register_id == value_register_idpanics withMemoryAccessViolation; - If the registers exceed the memory limit panics with
MemoryAccessViolation; - If
iterator_iddoes not correspond to an existing iterator panics withInvalidIteratorId - If between the creation of the iterator and calling
storage_iter_nextany modification to storage was done throughstorage_writeorstorage_removethe iterator is invalidated and the error message isIteratorWasInvalidated.
Current bugs
- Not implemented, currently we have
storage_iter_nextanddata_read+DATA_TYPE_STORAGE_ITERthat together fulfill the purpose, but have unspecified behavior.
Runtime Fees
Runtime fees are measured in Gas. Gas price will be discussed separately.
When a transaction is converted into a receipt, the signer account is charged for the full cost of the transaction. This cost consists of extra attached gas, attached deposits and the transaction fee.
The total transaction fee is the sum of the following:
- A fee for creation of the receipt
- A fee for every action
Every Fee consists of 3 values measured in gas:
send_sirandsend_not_sir- the gas burned when the action is being created to be sent to a receiver.send_siris used whencurrent_account_id == receiver_id(current_account_idis asigner_idfor a signed transaction).send_not_siris used whencurrent_account_id != receiver_id
execution- the gas burned when the action is being executed on the receiver's account.
Receipt creation cost
There are 2 types of receipts:
- Action receipts ActionReceipt
- Data receipts DataReceipt
A transaction is converted into an ActionReceipt. Data receipts are used for data dependencies and will be discussed separately.
The Fee for an action receipt creation is described in the config action_receipt_creation_config.
Example: when a signed transaction is being converted into a receipt, the gas for action_receipt_creation_config.send is being burned immediately,
while the gas for action_receipt_creation_config.execution is only charged, but not burned. It'll be burned when
the newly created receipt is executed on the receiver's account.
Fees for actions
Every Action has a corresponding Fee(s) described in the config action_creation_config.
Similar to a receipt creation costs, the send gas is burned when an action is added to a receipt to be sent, and the execution gas is only charged, but not burned.
Fees are either a base fee or a fee per byte of some data within the action.
Here is the list of actions and their corresponding fees:
- CreateAccount uses
- the base fee
create_account_cost
- the base fee
- DeployContract uses the sum of the following fees:
- the base fee
deploy_contract_cost - the fee per byte of the contract code to be deployed with the fee
deploy_contract_cost_per_byteTo compute the number of bytes for a deploy contract actiondeploy_contract_actionusedeploy_contract_action.code.len()
- the base fee
- FunctionCall uses the sum of the following fees:
- the base fee
function_call_cost - the fee per byte of method name string and per byte of arguments with the fee
function_call_cost_per_byte. To compute the number of bytes for a function call actionfunction_call_actionusefunction_call_action.method_name.as_bytes().len() + function_call_action.args.len()
- the base fee
- Transfer uses one of the following fees:
- if the
receiver_idis an Implicit Account ID, then a sum of base fees is used:- the create account base fee
create_account_cost - the transfer base fee
transfer_cost - the add full access key base fee
add_key_cost.full_access_cost
- the create account base fee
- if the
receiver_idis NOT an Implicit Account ID, then only the base fee is used:- the transfer base fee
transfer_cost
- the transfer base fee
- if the
- Stake uses
- the base fee
stake_cost
- the base fee
- AddKey uses one of the following fees:
- if the access key is
AccessKeyPermission::FullAccessthe base fee is used- the add full access key base fee
add_key_cost.full_access_cost
- the add full access key base fee
- if the access key is
AccessKeyPermission::FunctionCallthe sum of the fees is used- the add function call permission access key base fee
add_key_cost.function_call_cost - the fee per byte of method names with extra byte for every method with the fee
add_key_cost.function_call_cost_per_byteTo compute the number of bytes forfunction_call_permissionusefunction_call_permission.method_names.iter().map(|name| name.as_bytes().len() as u64 + 1).sum::<u64>()
- the add function call permission access key base fee
- if the access key is
- DeleteKey uses
- the base fee
delete_key_cost
- the base fee
- DeleteAccount uses
- the base fee
delete_account_cost - action receipt creation fee for creating Transfer to send remaining funds to
beneficiary_id - full transfer fee described in the corresponding item
- the base fee
Gas tracking
In Runtime, gas is tracked in the following fields of ActionResult struct:
gas_burnt- irreversible amount of gas spent on computations.gas_used- includes burnt gas and gas attached to the newActionReceipts created during the method execution.gas_burnt_for_function_call- stores gas burnt during function call execution. Later, contract account gets 30% of it as a reward for a possibility to invoke the function.
Initially runtime charges gas_used from the account. Some gas may be refunded later, see Refunds.
At first, we charge fees related to conversion from SignedTransaction to ActionReceipt and future execution of this receipt:
- costs of all
SignedTransactions passed toRuntime::applyare computed intx_costfunction during validation; total_costis deducted from signer, which is a sum of:gas_to_balance(gas_burnt)wheregas_burntis action receipt send fee +total_send_fees(transaction.actions));gas_to_balance(gas_remaining)wheregas_remainingis action receipt exec fee +total_prepaid_exec_fees(transaction.actions)to pay all remaining fees caused by transaction;total_deposit(transaction.actions);
- each transaction is converted to receipt and passed to
Runtime::process_receipt.
Then each ActionReceipt is passed to Runtime::apply_action_receipt where gas is tracked as follows:
ActionResultis created withActionReceiptexecution fee;- all actions inside
ActionReceiptare passed toRuntime::apply_action; ActionResultwith charged base execution fees is created there;- if action execution leads to new
ActionReceipts creation, correspondingaction_[action_name]function adds new fees to theActionResult. E.g.action_delete_accountalso charges the following fees:gas_burnt: send fee for newActionReceiptcreation + complex send fee forTransferto beneficiary accountgas_used:gas_burnt+ exec fee for createdActionReceipt+ complex exec fee forTransfer
- all computed
ActionResults are merged into one, where all gas values are summed up; - unused gas is refunded in
generate_refund_receipts, after subtracting the gas refund fee, see Refunds.
Inside VMLogic, the fees are tracked in the GasCounter struct.
The VM itself is called in the action_function_call inside Runtime. When all actions are processed, the result is returned as a VMOutcome, which is later merged with ActionResult.
Example
Let's say we have the following transaction:
#![allow(unused)]
fn main() {
Transaction {
    signer_id: "alice.near",
    public_key: "2onVGYTFwyaGetWckywk92ngBiZeNpBeEjuzSznEdhRE",
    nonce: 23,
    receiver_id: "lockup.alice.near",
    block_hash: "3CwEMonK6MmKgjKePiFYgydbAvxhhqCPHKuDMnUcGGTK",
    actions: [
        Action::CreateAccount(CreateAccountAction {}),
        Action::Transfer(TransferAction {
            deposit: 100000000000000000000000000,
        }),
        Action::DeployContract(DeployContractAction {
            code: vec![/*<...128000 bytes...>*/],
        }),
        Action::FunctionCall(FunctionCallAction {
            method_name: "new",
            args: b"{\"owner_id\": \"alice.near\"}".to_vec(),
            gas: 25000000000000,
            deposit: 0,
        }),
    ],
}
}
It has signer_id != receiver_id so it will use send_not_sir for send fees.
It contains 4 actions with 2 actions that requires to compute number of bytes.
We assume code in DeployContractAction contains 128000 bytes. And FunctionCallAction has
method_name with length of 3 and args length of 26, so total of 29.
First let's compute the amount that will be burned immediately for sending a receipt.
burnt_gas = \
    config.action_receipt_creation_config.send_not_sir + \
    config.action_creation_config.create_account_cost.send_not_sir + \
    config.action_creation_config.transfer_cost.send_not_sir + \
    config.action_creation_config.deploy_contract_cost.send_not_sir + \
    128000 * config.action_creation_config.deploy_contract_cost_per_byte.send_not_sir + \
    config.action_creation_config.function_call_cost.send_not_sir + \
    29 * config.action_creation_config.function_call_cost_per_byte.send_not_sir
Now, by using burnt_gas, we can calculate the total transaction fee
total_transaction_fee = burnt_gas + \
    config.action_receipt_creation_config.execution + \
    config.action_creation_config.create_account_cost.execution + \
    config.action_creation_config.transfer_cost.execution + \
    config.action_creation_config.deploy_contract_cost.execution + \
    128000 * config.action_creation_config.deploy_contract_cost_per_byte.execution + \
    config.action_creation_config.function_call_cost.execution + \
    29 * config.action_creation_config.function_call_cost_per_byte.execution
This total_transaction_fee is the amount of gas required to create a new receipt from the transaction.
NOTE: There are extra amounts required to prepay for deposit in TransferAction and gas in FunctionCallAction, but this is not part of the total transaction fee.
Function Call
In this section we provide an explanation how the FunctionCall action execution works, what are
the inputs and what are the outputs. Suppose runtime received the following ActionReceipt:
#![allow(unused)]
fn main() {
ActionReceipt {
     id: "A1",
     signer_id: "alice",
     signer_public_key: "6934...e248",
     receiver_id: "dex",
     predecessor_id: "alice",
     input_data_ids: [],
     output_data_receivers: [],
     actions: [FunctionCall { gas: 100000, deposit: 100000u128, method_name: "exchange", args: "{arg1, arg2, ...}", ... }],
 }
}
input_data_ids to PromiseResults
ActionReceipt.input_data_ids must be satisfied before execution (see
Receipt Matching). Each of ActionReceipt.input_data_ids will be converted to
the PromiseResult::Successful(Vec<u8>) if data_id.data is Some(Vec<u8>) otherwise if
data_id.data is None promise will be PromiseResult::Failed.
Input
The FunctionCall executes in the receiver_id account environment.
- a vector of Promise Results which can be accessed by a
promise_resultimport PromisesAPIpromise_result) - the original Transaction
signer_id,signer_public_keydata from the ActionReceipt (e.g.method_name,args,predecessor_id,deposit,prepaid_gas(which isgasin FunctionCall)) - a general blockchain data (e.g.
block_index,block_timestamp) - read data from the account storage
A full list of the data available for the contract can be found in Context API and Trie
Execution
In order to implement this action, the runtime will:
- load the contract code from the
receiver_idaccount’s storage; - parse, validate and instrument the contract code (see Preparation);
- optionally, convert the contract code to a different executable format;
- instantiate the WASM module, linking runtime-provided functions defined in the Bindings Spec & running the start function; and
- invoke the function that has been exported from the wasm module with the name matching
that specified in the
FunctionCall.method_namefield.
Note that some of these steps may be executed during the
DeployContractAction instead. This is largely an
optimization of the FunctionCall gas fee, and must not result in an observable behavioral
difference of the FunctionCall action.
During the execution of the contract, the runtime will:
- count burnt gas on execution;
- count used gas (which is
burnt gas+ gas attached to the new created receipts); - measure the increase in account’s storage usage as a result of this call;
- collect logs produced by the contract;
- set the return data; and
- create new receipts through PromisesAPI.
Output
The output of the FunctionCall:
- storage updates - changes to the account trie storage which will be applied on a successful call
burnt_gas,used_gas- see Runtime Feesbalance- unspent account balance (account balance could be spent on deposits of newly createdFunctionCalls orTransferActions to other contracts)storage_usage- storage_usage after ActionReceipt applicationlogs- during contract execution, utf8/16 string log records could be created. Logs are not persistent currently.new_receipts- newActionReceiptscreated during the execution. These receipts are going to be sent to the respectivereceiver_ids (see Receipt Matching explanation)- result could be either
ReturnData::Value(Vec<u8>)orReturnData::ReceiptIndex(u64)`
Value Result
If applied ActionReceipt contains output_data_receivers,
runtime will create DataReceipt for each of data_id and receiver_id and data equals
returned value. Eventually, these DataReceipt will be delivered to the corresponding receivers.
ReceiptIndex Result
Successful result could not return any Value, but generates a bunch of new ActionReceipts instead.
One example could be a callback. In this case, we assume the new Receipt will send its Value
Result to the output_data_receivers of the current
ActionReceipt.
Errors
As with other actions, errors can be divided into two categories: validation error and execution error.
Validation Error
-
If there is zero gas attached to the function call, a
#![allow(unused)]
fn main() {
/// The attached amount of gas in a FunctionCall action has to be a positive number.
FunctionCallZeroAttachedGas,
}
error will be returned
-
If the length of the method name to be called exceeds
max_length_method_name, a genesis parameter whose current value is256, a#![allow(unused)] fn main() { /// The length of the method name exceeded the limit in a Function Call action. FunctionCallMethodNameLengthExceeded { length: u64, limit: u64 } }error is returned.
-
If the length of the argument to the function call exceeds
max_arguments_length, a genesis parameter whose current value is4194304(4MB), a#![allow(unused)] fn main() { /// The length of the arguments exceeded the limit in a Function Call action. FunctionCallArgumentsLengthExceeded { length: u64, limit: u64 } }error is returned.
Execution Error
There are three types of errors which may occur when applying a function call action:
FunctionCallError, ExternalError, and StorageError.
-
FunctionCallErrorincludes everything from around the execution of the wasm binary, from compiling wasm to native to traps occurred while executing the compiled native binary. More specifically, it includes the following errors:#![allow(unused)] fn main() { pub enum FunctionCallError { /// Wasm compilation error CompilationError(CompilationError), /// Wasm binary env link error LinkError { msg: String, }, /// Import/export resolve error MethodResolveError(MethodResolveError), /// A trap happened during execution of a binary WasmTrap(WasmTrap), WasmUnknownError, HostError(HostError), } } -
CompilationErrorincludes errors that can occur during the compilation of wasm binary. -
LinkErroris returned when wasmer runtime is unable to link the wasm module with provided imports. -
MethodResolveErroroccurs when the method in the action cannot be found in the contract code. -
WasmTraperror happens when a trap occurs during the execution of the binary. Traps here include#![allow(unused)] fn main() { pub enum WasmTrap { /// An `unreachable` opcode was executed. Unreachable, /// Call indirect incorrect signature trap. IncorrectCallIndirectSignature, /// Memory out of bounds trap. MemoryOutOfBounds, /// Call indirect out of bounds trap. CallIndirectOOB, /// An arithmetic exception, e.g. divided by zero. IllegalArithmetic, /// Misaligned atomic access trap. MisalignedAtomicAccess, /// Breakpoint trap. BreakpointTrap, /// Stack overflow. StackOverflow, /// Generic trap. GenericTrap, } } -
WasmUnknownErroroccurs when something inside wasmer goes wrong -
HostErrorincludes errors that might be returned during the execution of a host function. Those errors are#![allow(unused)] fn main() { pub enum HostError { /// String encoding is bad UTF-16 sequence BadUTF16, /// String encoding is bad UTF-8 sequence BadUTF8, /// Exceeded the prepaid gas GasExceeded, /// Exceeded the maximum amount of gas allowed to burn per contract GasLimitExceeded, /// Exceeded the account balance BalanceExceeded, /// Tried to call an empty method name EmptyMethodName, /// Smart contract panicked GuestPanic { panic_msg: String }, /// IntegerOverflow happened during a contract execution IntegerOverflow, /// `promise_idx` does not correspond to existing promises InvalidPromiseIndex { promise_idx: u64 }, /// Actions can only be appended to non-joint promise. CannotAppendActionToJointPromise, /// Returning joint promise is currently prohibited CannotReturnJointPromise, /// Accessed invalid promise result index InvalidPromiseResultIndex { result_idx: u64 }, /// Accessed invalid register id InvalidRegisterId { register_id: u64 }, /// Iterator `iterator_index` was invalidated after its creation by performing a mutable operation on trie IteratorWasInvalidated { iterator_index: u64 }, /// Accessed memory outside the bounds MemoryAccessViolation, /// VM Logic returned an invalid receipt index InvalidReceiptIndex { receipt_index: u64 }, /// Iterator index `iterator_index` does not exist InvalidIteratorIndex { iterator_index: u64 }, /// VM Logic returned an invalid account id InvalidAccountId, /// VM Logic returned an invalid method name InvalidMethodName, /// VM Logic provided an invalid public key InvalidPublicKey, /// `method_name` is not allowed in view calls ProhibitedInView { method_name: String }, /// The total number of logs will exceed the limit. NumberOfLogsExceeded { limit: u64 }, /// The storage key length exceeded the limit. KeyLengthExceeded { length: u64, limit: u64 }, /// The storage value length exceeded the limit. ValueLengthExceeded { length: u64, limit: u64 }, /// The total log length exceeded the limit. TotalLogLengthExceeded { length: u64, limit: u64 }, /// The maximum number of promises within a FunctionCall exceeded the limit. NumberPromisesExceeded { number_of_promises: u64, limit: u64 }, /// The maximum number of input data dependencies exceeded the limit. NumberInputDataDependenciesExceeded { number_of_input_data_dependencies: u64, limit: u64 }, /// The returned value length exceeded the limit. ReturnedValueLengthExceeded { length: u64, limit: u64 }, /// The contract size for DeployContract action exceeded the limit. ContractSizeExceeded { size: u64, limit: u64 }, /// The host function was deprecated. Deprecated { method_name: String }, } } -
ExternalErrorincludes errors that occur during the execution insideExternal, which is an interface between runtime and the rest of the system. The possible errors are:#![allow(unused)] fn main() { pub enum ExternalError { /// Unexpected error which is typically related to the node storage corruption. /// It's possible the input state is invalid or malicious. StorageError(StorageError), /// Error when accessing validator information. Happens inside epoch manager. ValidatorError(EpochError), } } -
StorageErroroccurs when state or storage is corrupted.
Contract preparation
This document describes the contract preparation and instrumentation process as well as the limitations this process imposes on the contract authors.
In order to provide high performance execution of the function calls, the near validator utilizes
ahead-of-time preparation of the contract WASM code. Today the contract code is prepared during the
execution of the DeployContractAction. The results are then saved and later reported to the
user when a [FunctionCall] is invoked.
Note that only some parts of this document are normative. This document delves into implementation details, which may change in the future as long as the behavior documented by the normative portions of this book is maintained. The non-normative portions of this document will be called out as such.
High level overview
This section is not normative.
Upon initiation of a contract deployment, broadly the following operations will be executed: validation, instrumentation, conversion to machine code (compilation) and storage of the compiled artifacts in the account’s storage.
Functions exported from the contract module may then be invoked through the mechanisms provided by the protocol. Two common ways to call a function is by submitting a function call action onto the chain or via a cross-contract call.
Most of the errors that have occurred as part of validation, instrumentation, compilation, etc. are
saved and reported when a FunctionCallAction is submitted. Deployment itself may only report
errors relevant to itself, as described in the specification for DeployContractAction.
Validation
A number of limits are imposed on the WebAssembly module that is being parsed:
- The length of the wasm code must not exceed
max_contract_sizegenesis configuration parameter; - The wasm module must be a valid module according to the WebAssembly core 1.0 specification (this means no extensions such as multi value returns or SIMD; this limitation may be relaxed in the future).
- The wasm module may contain no more than:
1_000_000distinct signatures;1_000_000function imports and local function definitions;100_000imports;100_000exports;1_000_000global imports and module-local global definitions;100_000data segments;1table;1memory;
- UTF-8 strings comprising the wasm module definition (e.g. export name) may not exceed
100_000bytes each; - Function definitions may not specify more than
50_000locals; - Signatures may not specify more than
1_000parameters; - Signatures may not specify more than
1_000results; - Tables may not specify more than
10_000_000entries;
If the contract code is invalid, the first violation in the binary encoding of the WebAssembly module shall be reported. These additional requirements are imposed after the module is parsed:
- The wasm module may contain no more function imports and local definitions than specified in the
max_functions_number_per_contractgenesis configuration parameter; and
These additional requirements are imposed after the instrumentation, as documented in the later sections:
- All imports may only import from the
envmodule.
Memory normalization
All near contracts have the same amount of memory made available for execution. The exact amount is
specified specified by the initial_memory_pages and max_memory_pages genesis configuration
parameters. In order to ensure a level playing field, any module-local memory definitions are
transparently replaced with an import of a standard memory instance from env.memory.
If the original memory instance definition specified limits different from those specified by the genesis configuration parameters, the limits are reset to the configured parameters.
Gas instrumentation
In order to implement precise and efficient gas accounting, the contract code is analyzed and instrumented with additional operations before the compilation occurs. One such instrumentation implements accounting of the gas fees.
Gas fees are accounted for at a granularity of sequences of instructions forming a metered block
and are consumed before execution of any instruction part of such a sequence. The accounting
mechanism verifies the remaining gas is sufficient, and subtracts the gas fee from the remaining
gas budget before continuing execution. In the case where the remaining gas balance is insufficient
to continue execution, the GasExceeded error is raised and execution of the contract is
terminated.
The gas instrumentation analysis will segment a wasm function into metered blocks. In the end, every instruction will belong to exactly one metered block. The algorithm uses a stack of metered blocks and instructions are assigned to the metered block on top of the stack. The following terminology will be used throughout this section to refer to metered block operations:
- active metered block – the metered block at the top of the stack;
- pop – the active metered block is removed from the top of the stack;
- push – a new metered block is added to the stack, becoming the new active metered block.
A metered block is pushed onto the stack upon a function entry and after every if and loop
instruction. After the br, br_if, br_table, else & return (pseudo-)instructions the
active metered block is popped and a new metered block is pushed onto the stack.
The end pseudo-instruction associated with the if & loop instructions, or when it terminates
the function body, will cause the top-most metered block to be popped off the stack. As a
consequence, the instructions within a metered block need not be consecutive in the original
function. If the if..end, loop..end or block..end control block terminated by this end
pseudo-instruction contained any branching instructions targeting control blocks other than the
control block terminated by this end pseudo instruction, the currently active metered block is
popped and a new metered block is pushed.
Note that some of the instructions considered to affect the control flow in the WebAssembly
specification such as call, call_indirect or unreachable do not affect metered block
construction and are accounted for much like other instructions not mentioned in this section. This
also means that calling the used_gas host function at different points of the same metered block
would return the same value if the base cost was 0.
All the instructions covered by a metered block are assigned a fee based on the regular_op_cost
genesis parameter. Pseudo-instructions do not cause any fee to be charged. A sum of these fees is
then charged by instrumentation inserted at the beginning of each metered block.
Examples
This section is not normative.
In this section some examples of the instrumentation are presented as an understanding aid to the specification above. The examples are annotated with comments describing how much gas is charged at a specific point of the program. The programs presented here are not intended to be executable or to produce meaningful behavior.
block instruction does not terminate a metered block
(func
  (; charge_gas(6 regular_op_cost) ;)
  nop
  block
    nop
    unreachable
    nop
  end
  nop)
This function has just 1 metered block, covering both the block..end block as well as the 2 nop
instructions outside of it. As a result the gas fee for all 6 instructions will be charged at the
beginning of the function (even if we can see unreachable would be executed after 4 instructions,
terminating the execution).
Branching instructions pop a metered block
Introducing a conditional branch to the example from the previous section would split the metered block and the gas accounting would be introduced in two locations:
(func
  (; charge_gas([nop block br.0 nop]) ;)
  nop
  block
    br 0
    (; charge_gas([nop nop]) ;)
    nop
    nop
  end
  nop)
Note that the first metered block is disjoint and covers the [nop, block, br 0] instruction
sequence as well as the final nop. The analysis is able to deduce that the br 0 will not be
able to jump past the final nop instruction, and therefore is able to account for the gas fees
incurred by this instruction earlier.
Replacing br 0 with a return would enable jumping past this final nop instruction, splitting
the code into three distinct metered blocks instead:
(func
  (; charge_gas([nop block return]) ;)
  nop
  block
    return
    (; charge_gas([nop nop]) ;)
    nop
    nop
  end
  (; charge_gas([nop]) ;)
  nop)
if and loop push a new metered block
(func
  (; charge_gas([loop unreachable]) ;)
  loop
    (; charge_gas([br 0]) ;)
    br 0
  end
  unreachable
)
In this example the loop instruction will always introduce a new nested metered block for its
body, for the end pseudo-instruction as well as br 0 cause a backward jump back to the
beginning of the loop body. A similar reasoning works for if .. else .. end sequence since the
body is only executed conditionally:
(func
  (; charge_gas([i32.const.42 if nop]) ;)
  i32.const 42
  if
    (; charge_gas([nop nop]) ;)
    nop
    nop
  else
    (; charge_gas([unreachable]) ;)
    unreachable
  end
  nop)
Operand stack depth instrumentation
The max_stack_height genesis parameter imposes a limit on the number of entries the wasm
operand stack may contain during the contract execution.
The maximum operand stack height required for a function to execute successfully is computed
statically by simulating the operand stack operations executed by each instruction. For example,
i32.const 1 pushes 1 entry on the operand stack, whereas i32.add pops two entries and pushes 1
entry containing the result value. The maximum operand stack height of the if..else..end control
block is the larger of the heights for two bodies of the conditional. Stack operations for each
instruction are otherwise specified in the section 4 of the WebAssembly core 1.0 specification.
Before the call or call_indirect instructions are executed, the callee's required stack is
added to the current stack height counter and is compared with the max_stack_height parameter. A
trap is raised if the counter exceeds the limit. The instruction is executed, otherwise.
Note that the stack depth instrumentation runs after the gas instrumentation. At each point where gas is charged one entry worth of operand stack space is considered to be used.
Examples
This section is not normative.
Picking the example from the gas instrumentation section, we can tell that this function will use just 1 operand slot. Lets annotate the operand stack operations at each of the instructions:
(func
  (; charge_gas(...) ;)    (; [] => [gas] => [] ;)
  i32.const 42             (; [] => [i32]       ;)
  if                       (; [i32] => []       ;)
    (; charge_gas(...) ;)    (; [] => [gas] => [] ;)
    nop                      (; []                ;)
    nop                      (; []                ;)
  else
    (; charge_gas(...) ;)    (; [] => [gas] => [] ;)
    unreachable              (; []                ;)
  end
  nop                      (; [] ;)
)
We can see that at no point in time the operand stack contained more than 1 entry. As a result, the runtime will check that 1 entry is available in the operand stack before the function is invoked.
Receipt
All cross-contract (we assume that each account lives in its own shard) communication in Near happens through Receipts.
Receipts are stateful in a sense that they serve not only as messages between accounts but also can be stored in the account storage to await DataReceipts.
Each receipt has a predecessor_id (who sent it) and receiver_id the current account.
Receipts are one of 2 types: action receipts or data receipts.
Data Receipts are receipts that contains some data for some ActionReceipt with the same receiver_id.
Data Receipts have 2 fields: the unique data identifier data_id and data the received result.
data is an Option field and it indicates whether the result was a success or a failure. If it's Some, it means
the remote execution was successful and it represents the result as a vector of bytes.
Each ActionReceipt also contains fields related to data:
input_data_ids- a vector of input data with thedata_ids required for the execution of this receipt.output_data_receivers- a vector of output data receivers. It indicates where to send outgoing data. EachDataReceiverconsists ofdata_idandreceiver_idfor routing.
Before any action receipt is executed, all input data dependencies need to be satisfied. Which means all corresponding data receipts have to be received. If any of the data dependencies are missing, the action receipt is postponed until all missing data dependencies arrive.
Because chain and runtime guarantees that no receipts are missing, we can rely that every action receipt will be executed eventually (Receipt Matching explanation).
Each Receipt has the following fields:
predecessor_id
type:AccountId
The account_id which issued a receipt.
In case of a gas or deposit refund, the account ID is system.
receiver_id
type:AccountId
The destination account_id.
receipt_id
type:CryptoHash
An unique id for the receipt.
receipt
type: ActionReceipt | DataReceipt
There are 2 types of Receipt: ActionReceipt and DataReceipt. An ActionReceipt is a request to apply Actions, while a DataReceipt is a result of the application of these actions.
ActionReceipt
ActionReceipt represents a request to apply actions on the receiver_id side. It could be derived as a result of a Transaction execution or another ActionReceipt processing. ActionReceipt consists the following fields:
signer_id
type:AccountId
An account_id which signed the original transaction.
In case of a deposit refund, the account ID is system.
signer_public_key
type:PublicKey
The public key of an AccessKey which was used to sign the original transaction. In case of a deposit refund, the public key is empty (all bytes are 0).
gas_price
type:u128
Gas price which was set in a block where the original transaction has been applied.
output_data_receivers
type:[DataReceiver{ data_id: CryptoHash, receiver_id: AccountId }]
If smart contract finishes its execution with some value (not Promise), runtime creates a [DataReceipt]s for each of the output_data_receivers.
input_data_ids
type:[CryptoHash]_
input_data_ids are the receipt data dependencies. input_data_ids correspond to DataReceipt.data_id.
actions
type:FunctionCall|TransferAction|StakeAction|AddKeyAction|DeleteKeyAction|CreateAccountAction|DeleteAccountAction
DataReceipt
DataReceipt represents a final result of some contract execution.
data_id
type:CryptoHash
A unique DataReceipt identifier.
data
type:Option([u8])
Associated data in bytes. None indicates an error during execution.
Creating Receipt
Receipts can be generated during the execution of a SignedTransaction (see example) or during application of some ActionReceipt which contains a FunctionCall action. The result of the FunctionCall could be either another ActionReceipt or a DataReceipt (returned data).
Receipt Matching
Runtime doesn't require that Receipts come in a particular order. Each Receipt is processed individually. The goal of the Receipt Matching process is to match all ActionReceipts to the corresponding DataReceipts.
Processing ActionReceipt
For each incoming ActionReceipt runtime checks whether we have all the DataReceipts (defined as ActionsReceipt.input_data_ids) required for execution. If all the required DataReceipts are already in the storage, runtime can apply this ActionReceipt immediately. Otherwise we save this receipt as a Postponed ActionReceipt. Also we save Pending DataReceipts Count and a link from pending DataReceipt to the Postponed ActionReceipt. Now runtime will wait for all the missing DataReceipts to apply the Postponed ActionReceipt.
Postponed ActionReceipt
A Receipt which runtime stores until all the designated DataReceipts arrive.
key=account_id,receipt_idvalue=[u8]
Where account_id is Receipt.receiver_id, receipt_id is Receipt.receipt_id and value is a serialized Receipt (which type must be ActionReceipt).
Pending DataReceipt Count
A counter which counts pending DataReceipts for a Postponed Receipt initially set to the length of missing input_data_ids of the incoming ActionReceipt. It's decrementing with every new received DataReceipt:
key=account_id,receipt_idvalue=u32
Where account_id is AccountId, receipt_id is CryptoHash and value is an integer.
Pending DataReceipt for Postponed ActionReceipt
We index each pending DataReceipt so when a new DataReceipt arrives we connect it to the Postponed Receipt it belongs to.
key=account_id,data_idvalue=receipt_id
Processing DataReceipt
Received DataReceipt
First of all, runtime saves the incoming DataReceipt to the storage as:
key=account_id,data_idvalue=[u8]
Where account_id is Receipt.receiver_id, data_id is DataReceipt.data_id and value is a DataReceipt.data (which is typically a serialized result of the call to a particular contract).
Next, runtime checks if there are any Postponed ActionReceipt waiting for this DataReceipt by querying Pending DataReceipt to the Postponed Receipt. If there is no postponed receipt_id yet, we do nothing else. If there is a postponed receipt_id, we do the following:
- decrement
Pending Data Countfor the postponedreceipt_id - remove found
Pending DataReceiptto thePostponed ActionReceipt
If Pending DataReceipt Count is now 0 that means all the Receipt.input_data_ids are in storage and runtime can safely apply the Postponed Receipt and remove it from the store.
Case 1: Call to multiple contracts and await responses
Suppose runtime got the following ActionReceipt:
# Non-relevant fields are omitted.
Receipt{
    receiver_id: "alice",
    receipt_id: "693406"
    receipt: ActionReceipt {
        input_data_ids: []
    }
}
If execution return Result::Value
Suppose runtime got the following ActionReceipt (we use a python-like pseudo code):
# Non-relevant fields are omitted.
Receipt{
    receiver_id: "alice",
    receipt_id: "5e73d4"
    receipt: ActionReceipt {
        input_data_ids: ["e5fa44", "7448d8"]
    }
}
We can't apply this receipt right away: there are missing DataReceipt'a with IDs: ["e5fa44", "7448d8"]. Runtime does the following:
postponed_receipts["alice,5e73d4"] = borsh_serialize(
    Receipt{
        receiver_id: "alice",
        receipt_id: "5e73d4"
        receipt: ActionReceipt {
            input_data_ids: ["e5fa44", "7448d8"]
        }
    }
)
pending_data_receipt_store["alice,e5fa44"] = "5e73d4"
pending_data_receipt_store["alice,7448d8"] = "5e73d4"
pending_data_receipt_count = 2
Note: the subsequent Receipts could arrived in the current block or next, that's why we save Postponed ActionReceipt in the storage
Then the first pending Pending DataReceipt arrives:
# Non-relevant fields are omitted.
Receipt {
    receiver_id: "alice",
    receipt: DataReceipt {
        data_id: "e5fa44",
        data: "some data for alice",
    }
}
data_receipts["alice,e5fa44"] = borsh_serialize(Receipt{
    receiver_id: "alice",
    receipt: DataReceipt {
        data_id: "e5fa44",
        data: "some data for alice",
    }
};
pending_data_receipt_count["alice,5e73d4"] = 1`
del pending_data_receipt_store["alice,e5fa44"]
And finally the last Pending DataReceipt arrives:
# Non-relevant fields are omitted.
Receipt{
    receiver_id: "alice",
    receipt: DataReceipt {
        data_id: "7448d8",
        data: "some more data for alice",
    }
}
data_receipts["alice,7448d8"] = borsh_serialize(Receipt{
    receiver_id: "alice",
    receipt: DataReceipt {
        data_id: "7448d8",
        data: "some more data for alice",
    }
};
postponed_receipt_id = pending_data_receipt_store["alice,5e73d4"]
postponed_receipt = postponed_receipts[postponed_receipt_id]
del postponed_receipts[postponed_receipt_id]
del pending_data_receipt_count["alice,5e73d4"]
del pending_data_receipt_store["alice,7448d8"]
apply_receipt(postponed_receipt)
Receipt Validation Error
Some postprocessing validation is done after an action receipt is applied. The validation includes:
-
Whether the generated receipts are valid. A generated receipt can be invalid, if, for example, a function call generates a receipt to call another function on some other contract, but the contract name is invalid. Here there are mainly two types of errors:
-
account id is invalid. If the receiver id of the receipt is invalid, a
#![allow(unused)]
fn main() {
/// The `receiver_id` of a Receipt is not valid.
InvalidReceiverId { account_id: AccountId },
}
error is returned.
- some action is invalid. The errors returned here are the same as the validation errors mentioned in actions.
- Whether the account still has enough balance to pay for storage. If, for example, the execution of one function call action leads to some receipts that require transfer to be generated as a result, the account may no longer have enough balance after the transferred amount is deducted. In this case, a
#![allow(unused)]
fn main() {
/// ActionReceipt can't be completed, because the remaining balance will not be enough to cover storage.
LackBalanceForState {
    /// An account which needs balance
    account_id: AccountId,
    /// Balance required to complete an action.
    amount: Balance,
},
}
Refunds
When execution of a receipt fails or there is some unused amount of prepaid gas left after a function call, the Runtime generates refund receipts.
The are 2 types of refunds:
- Refunds for the failed receipt for attached deposits. Let's call them deposit refunds.
- Refunds for the unused gas and fees. Let's call them gas refunds.
Refund receipts are identified by having predecessor_id == "system". They are also special because they don't cost any gas to generate or execute. As a result, they also do not contribute to the block gas limit.
If the execution of a refund fails, the refund amount is burnt.
The refund receipt is an ActionReceipt that consists of a single action Transfer with the deposit amount of the refund.
Deposit Refunds
Deposit refunds are generated when an action receipt fails to execute. All attached deposit amounts are summed together and
sent as a refund to a predecessor_id (because only the predecessor can attach deposits).
Deposit refunds have the following fields in the ActionReceipt:
signer_idissystemsigner_public_keyis ED25519 key with data equal to 32 bytes of0.
Deposit refunds are free for the user and incur no refund fee.
Gas Refunds
Gas refunds are generated when a receipt used the amount of gas lower than the attached amount of gas.
If the receipt execution succeeded, the gas amount is equal to prepaid_gas + execution_gas - used_gas.
If the receipt execution failed, the gas amount is equal to prepaid_gas + execution_gas - burnt_gas.
The difference between burnt_gas and used_gas is the used_gas also includes the fees and the prepaid gas of
newly generated receipts, e.g. from cross-contract calls in function calls actions.
From this unspent gas amount, the network charges a gas refund fee, starting with protocol version 78. The exact fee is calculated as max(gas_refund_penalty * unspent_gas, min_gas_refund_penalty). As of version 78, gas_refund_penalty is 0% and min_gas_refund_penalty 0 Tgas, always resulting in a zero-cost fee. This is only a stepping stone to give projects time to adapt before the fee is taking effect. The plan is to increase this to 5% and 1 Tgas, as specified in NEP-536. There is no fixed timeline available for this.
Should the gas refund fee be equal or larger than the unspent gas, no refund will be produced.
If there is gas to refund left, the gas amount is converted to tokens by multiplying by the gas price at which the original transaction was generated.
Gas refunds have the following fields in the ActionReceipt:
signer_idis the actualsigner_idfrom the receipt that generates this refund.signer_public_keyis thesigner_public_keyfrom the receipt that generates this refund.
Access Key Allowance refunds
When an account used a restricted access key with FunctionCallPermission, it may have had a limited allowance.
The allowance was charged for the full amount of receipt fees including full prepaid gas.
To refund the allowance we distinguish between Deposit refunds and Gas refunds using signer_id in the action receipt.
If the signer_id == receiver_id && predecessor_id == "system" it means it's a gas refund and the runtime should try to refund the allowance.
Note, that it's not always possible to refund the allowance, because the access key can be deleted between the moment when the transaction was issued and when the gas refund arrived. In this case we use the best effort to refund the allowance. It means:
- the access key on the
signer_idaccount with the public keysigner_public_keyshould exist - the access key permission should be
FunctionCallPermission - the allowance should be set to
Somelimited value, instead of unlimited allowance (None) - the runtime uses saturating add to increase the allowance, to avoid overflows
Runtime
Runtime layer is used to execute smart contracts and other actions created by the users and preserve the state between the executions. It can be described from three different angles: going step-by-step through various scenarios, describing the components of the runtime, and describing the functions that the runtime performs.
Scenarios
- Financial transaction -- we examine what happens when the runtime needs to process a simple financial transaction;
- Cross-contract call -- the scenario when the user calls a contract that in turn calls another contract.
Components
The components of the runtime can be described through the crates:
near-vm-logic-- describes the interface that smart contract uses to interact with the blockchain. Encapsulates the behavior of the blockchain visible to the smart contract, e.g. fee rules, storage access rules, promise rules;near-vm-runnercrate -- a wrapper around Wasmer that does the actual execution of the smart contract code. It exposes the interface provided bynear-vm-logicto the smart contract;runtimecrate -- encapsulates the logic of how transactions and receipts should be handled. If it encounters a smart contract call within a transaction or a receipt it callsnear-vm-runner, for all other actions, like account creation, it processes them in-place.
The utility crates are:
near-runtime-fees-- a convenience crate that encapsulates configuration of fees. We might get rid ot it later;near-vm-errors-- contains the hierarchy of errors that can be occurred during transaction or receipt processing;near-vm-runner-standalone-- a runnable tool that allows running the runtime without the blockchain, e.g. for integration testing of L2 projects;runtime-params-estimator-- benchmarks the runtime and generates the config with the fees.
Separately, from the components we describe the Bindings Specification which is an
important part of the runtime that specifies the functions that the smart contract can call from its host -- the runtime.
The specification is defined in near-vm-logic, but it is exposed to the smart contract in near-vm-runner.
Functions
- Receipt consumption and production
- Fees
- Virtual machine
- Verification
Transactions
A transaction in Near is a list of actions and additional information:
#![allow(unused)]
fn main() {
pub struct Transaction {
    /// An account on which behalf transaction is signed
    pub signer_id: AccountId,
    /// An access key which was used to sign a transaction
    pub public_key: PublicKey,
    /// Nonce is used to determine order of transaction in the pool.
    /// It increments for a combination of `signer_id` and `public_key`
    pub nonce: Nonce,
    /// Receiver account for this transaction. If
    pub receiver_id: AccountId,
    /// The hash of the block in the blockchain on top of which the given transaction is valid
    pub block_hash: CryptoHash,
    /// A list of actions to be applied
    pub actions: Vec<Action>,
}
}
Signed Transaction
SignedTransaction is what the node receives from a wallet through JSON-RPC endpoint and then routed to the shard where receiver_id account lives. Signature proves an ownership of the corresponding public_key (which is an AccessKey for a particular account) as well as authenticity of the transaction itself.
#![allow(unused)]
fn main() {
pub struct SignedTransaction {
    pub transaction: Transaction,
    /// A signature of a hash of the Borsh-serialized Transaction
    pub signature: Signature,
}
Take a look some scenarios how transaction can be applied.
Batched Transaction
A Transaction can contain a list of actions. When there are more than one action in a transaction, we refer to such
transaction as batched transaction. When such a transaction is applied, it is equivalent to applying each of the actions
separately, except:
- After processing a
CreateAccountaction, the rest of the action is applied on behalf of the account that is just created. This allows one to, in one transaction, create an account, deploy a contract to the account, and call some initialization function on the contract. DeleteAccountaction, if present, must be the last action in the transaction.
The number of actions in one transaction is limited by VMLimitConfig::max_actions_per_receipt, the current value of which
is 100.
Transaction Validation and Errors
When a transaction is received, various checks will be performed to ensure its validity. This section lists the checks and potentially errors returned when they fail.
Basic Validation
Basic validation of a transaction can be done without the state.
Valid signer_id format
Whether signer_id is valid. If not, a
#![allow(unused)]
fn main() {
/// TX signer_id is not in a valid format or not satisfy requirements see `near_core::primitives::utils::is_valid_account_id`
InvalidSignerId { signer_id: AccountId },
}
error is returned.
Valid receiver_id format
Whether receiver_id is valid. If not, a
#![allow(unused)]
fn main() {
/// TX receiver_id is not in a valid format or not satisfy requirements see `near_core::primitives::utils::is_valid_account_id`
InvalidReceiverId { receiver_id: AccountId },
}
error is returned.
Valid signature
Whether transaction is signed by the access key that corresponds to public_key. If not, a
#![allow(unused)]
fn main() {
/// TX signature is not valid
InvalidSignature
}
error is returned.
Number of actions does not exceed max_actions_per_receipt
Whether the number of actions included in the transaction is not greater than max_actions_per_receipt. If not, a
#![allow(unused)]
fn main() {
 /// The number of actions exceeded the given limit.
TotalNumberOfActionsExceeded { total_number_of_actions: u64, limit: u64 }
}
error is returned.
DeleteAccount is the last action
Among the actions in the transaction, whether DeleteAccount, if present, is the last action. If not, a
#![allow(unused)]
fn main() {
/// The delete action must be a final action in transaction
DeleteActionMustBeFinal
}
error is returned.
Prepaid gas does not exceed max_total_prepaid_gas
Whether total prepaid gas does not exceed max_total_prepaid_gas. If not, a
#![allow(unused)]
fn main() {
/// The total prepaid gas (for all given actions) exceeded the limit.
TotalPrepaidGasExceeded { total_prepaid_gas: Gas, limit: Gas }
}
error is returned.
Valid actions
Whether each included action is valid. Details of such check can be found in Actions.
Validation With State
After the basic validation is done, we check the transaction against current state to perform further validation.
Existing signer_id
Whether signer_id exists. If not, a
#![allow(unused)] fn main() { /// TX signer_id is not found in a storage SignerDoesNotExist { signer_id: AccountId }, }
error is returned.
Valid transaction nonce
Whether the transaction nonce is greater than the existing nonce on the access key. If not, a
#![allow(unused)] fn main() { /// Transaction nonce must be strictly greater than `account[access_key].nonce`. InvalidNonce { tx_nonce: Nonce, ak_nonce: Nonce }, }
error is returned.
Enough balance to cover transaction cost
If signer_id account has enough balance to cover the cost of the transaction. If not, a
#![allow(unused)] fn main() { /// Account does not have enough balance to cover TX cost NotEnoughBalance { signer_id: AccountId, balance: Balance, cost: Balance, } }
error is returned.
Access Key is allowed to cover transaction cost
If the transaction is signed by a function call access key and the function call access key does not have enough allowance to cover the cost of the transaction, a
#![allow(unused)] fn main() { /// Access Key does not have enough allowance to cover transaction cost NotEnoughAllowance { account_id: AccountId, public_key: PublicKey, allowance: Balance, cost: Balance, } }
error is returned.
Sufficient account balance to cover storage
If signer_id account does not have enough balance to cover its storage after paying for the cost of the transaction, a
#![allow(unused)] fn main() { /// Signer account doesn't have enough balance after transaction. LackBalanceForState { /// An account which doesn't have enough balance to cover storage. signer_id: AccountId, /// Required balance to cover the state. amount: Balance, } }
error is returned.
Function call access key validations
If a transaction is signed by a function call access key, the following errors are possible:
InvalidAccessKeyError::RequiresFullAccessif the transaction contains more than one action or if the only action it contains is not aFunctionCallaction.InvalidAccessKeyError::DepositWithFunctionCallif the function call action has nonzerodeposit.InvalidAccessKeyError::ReceiverMismatch { tx_receiver: AccountId, ak_receiver: AccountId }if transaction'sreceiver_iddoes not match thereceiver_idof the access key.InvalidAccessKeyError::MethodNameMismatch { method_name: String }if the name of the method that the transaction tries to call is not allowed by the access key.
Scenarios
In the following sections we go over the common scenarios that runtime takes care of.
Financial Transaction
Suppose Alice wants to transfer 100 tokens to Bob. In this case we are talking about native Near Protocol tokens, oppose to user-defined tokens implemented through a smart contract. There are several way this can be done:
- Direct transfer through a transaction containing transfer action;
- Alice calling a smart contract that in turn creates a financial transaction towards Bob.
In this section we are talking about the former simpler scenario.
Pre-requisites
For this to work both Alice and Bob need to have accounts and an access to them through the full access keys.
Suppose Alice has account alice_near and Bob has account bob_near. Also, some time in the past,
each of them has created a public-secret key-pair, saved the secret key somewhere (e.g. in a wallet application)
and created a full access key with the public key for the account.
We also need to assume that both Alice and Bob have some number of tokens on their accounts. Alice needs >100 tokens on her account so that she could transfer 100 tokens to Bob, but also Alice and Bob need to have some tokens on balance to pay for the data they store on-chain for their accounts -- which is essentially the refundable cost of the storage occupied by the account in the Near Protocol network.
Creating a transaction
To send the transaction neither Alice nor Bob need to run a node. However, Alice needs a way to create and sign a transaction structure. Suppose Alice uses near-shell or any other third-party tool for that. The tool then creates the following structure:
Transaction {
signer_id: "alice_near",
public_key: "ed25519:32zVgoqtuyRuDvSMZjWQ774kK36UTwuGRZMmPsS6xpMy",
nonce: 57,
receiver_id: "bob_near",
block_hash: "CjNSmWXTWhC3EhRVtqLhRmWMTkRbU96wUACqxMtV1uGf",
actions: vec![
Action::Transfer(TransferAction {deposit: 100} )
],
}
Which contains one token transfer action, the id of the account that signs this transaction (alice_near)
the account towards which this transaction is addressed (bob_near). Alice also uses the public key
associated with one of the full access keys of alice_near account.
Additionally, Alice uses the nonce which is unique value that allows Near Protocol to differentiate the transactions (in case there are several transfers coming in rapid succession) which should be strictly increasing with each transaction. Unlike in Ethereum, nonces are associated with access keys, oppose to the entire accounts, so several users using the same account through different access keys need not to worry about accidentally reusing each other's nonces.
The block hash is used to calculate a transaction's "freshness". It
is used to make sure a transaction does not get lost (let's say
somewhere in the network) and then arrive days, weeks, or years later
when it is not longer relevant and would be undesirable to execute.
A transaction does not need to arrive at a specific block, instead
it is required to arrive within a certain number of blocks from the block
identified by the block_hash. Any transaction arriving outside this
threshold is considered to be invalid. Allowed delay is defined by
transaction_validity_period option in the chain’s genesis file. On
mainnet, this value is 86400 (which corresponds to roughly a day) and
on testnet it is 100.
near-shell or other tool that Alice uses then signs this transaction, by: computing the hash of the transaction and signing it
with the secret key, resulting in a SignedTransaction object.
Sending the transaction
To send the transaction, near-shell connects through the RPC to any Near Protocol node and submits it.
If users wants to wait until the transaction is processed they can use send_tx_commit JSONRPC method which waits for the
transaction to appear in a block. Otherwise the user can use send_tx_async.
Transaction to receipt
We skip the details on how the transaction arrives to be processed by the runtime, since it is a part of the blockchain layer
discussion.
We consider the moment where SignedTransaction is getting passed to Runtime::apply of the
runtime crate.
Runtime::apply immediately passes transaction to Runtime::process_transaction
which in turn does the following:
- Verifies that transaction is valid;
- Applies initial reversible and irreversible charges to
alice_nearaccount; - Creates a receipt with the same set of actions directed towards
bob_near.
The first two items are performed inside Runtime::verify_and_charge_transaction method.
Specifically it does the following checks:
- Verifies that the signature of the transaction is correct based on the transaction hash and the attached public key;
- Retrieves the latest state of the
alice_nearaccount, and simultaneously checks that it exists; - Retrieves the state of the access key of that
alice_nearused to sign the transaction; - Checks that transaction nonce is greater than the nonce of the latest transaction executed with that access key;
- Subtracts the
total_costof the transaction from the account balance, or throwsInvalidTxError::NotEnoughBalance. If the transaction is part of a transaction by a FunctionCall Access Key, subtracts thetotal_costfrom theallowanceor throwsInvalidAccessKeyError::NotEnoughAllowance; - Checks whether the
signeraccount has insufficient balance for the storage deposit and throwsInvalidTxError::LackBalanceForStateif so - If the transaction is part of a transaction by a FunctionCall Access Key, throws
InvalidAccessKeyError::RequiresFullAccess; - Updates the
alice_nearaccount with the new balance and the used access key with the new nonce;
If any of the above operations fail all of the changes will be reverted.
Processing receipt
The receipt created in the previous section will eventually arrive to a runtime on the shard that hosts bob_near account.
Again, it will be processed by Runtime::apply which will immediately call Runtime::process_receipt.
It will check that this receipt does not have data dependencies (which is only the case of function calls) and will then call Runtime::apply_action_receipt on TransferAction.
Runtime::apply_action_receipt will perform the following checks:
- Retrieves the state of
bob_nearaccount, if it still exists (it is possible that Bob has deleted his account concurrently with the transfer transaction); - Computes the cost of processing a receipt and a transfer action;
- Computes how much reward should be burnt;
- Checks if
bob_nearstill exists and if it does, deposits the transferred tokens tobob_near; - Checks if
bob_nearstill exists and if so, deposits the gas reward to thebob_nearaccount; - Checks if
bob_nearhas enough balance for the storage deposit, the transaction's temporary state is dropped/rolled back if there is not enough balance;
Cross-Contract Call
This guide assumes that you have read the Financial Transaction section.
Suppose Alice is a calling a function reserve_trip(city: String, date: u64) on a smart contract deployed to a travel_agency
account which in turn calls reserve(date: u64) on a smart contract deployed to a hotel_near account and attaches
a callback to method hotel_reservation_complete(date: u64) on travel_agency.

Pre-requisites
It possible for Alice to call the travel_agency in several different ways.
In the simplest scenario Alice has an account alice_near and she has a full access key.
She then composes the following transaction that calls the travel_agency:
Transaction {
signer_id: "alice_near",
public_key: "ed25519:32zVgoqtuyRuDvSMZjWQ774kK36UTwuGRZMmPsS6xpMy",
nonce: 57,
receiver_id: "travel_agency",
block_hash: "CjNSmWXTWhC3EhRVtqLhRmWMTkRbU96wUACqxMtV1uGf",
actions: vec![
Action::FunctionCall(FunctionCallAction {
method_name: "reserve_trip",
args: "{\"city\": \"Venice\", \"date\": 20191201}",
gas: 1000000,
tokens: 100,
})
],
}
Here the public key corresponds to the full access key of alice_near account. All other fields in Transaction were
discussed in the Financial Transaction section. The FunctionCallAction action describes how
the contract should be called. The receiver_id field in Transaction already establishes what contract should be executed,
FunctionCallAction merely describes how it should be executed. Interestingly, the arguments is just a blob of bytes,
it is up to the contract developer what serialization format they choose for their arguments. In this example, the contract
developer has chosen to use JSON and so the tool that Alice uses to compose this transaction is expected to use JSON too
to pass the arguments. gas declares how much gas alice_near has prepaid for dynamically calculated fees of the smart
contract executions and other actions that this transaction may spawn. The tokens is the amount of alice_near attaches
to be deposited to whatever smart contract that it is calling to. Notice, gas and tokens are in different units of
measurement.
Now, consider a slightly more complex scenario. In this scenario Alice uses a restricted access key to call the function.
That is the permission of the access key is not AccessKeyPermission::FullAccess but is instead: AccessKeyPermission::FunctionCall(FunctionCallPermission)
where
FunctionCallPermission {
allowance: Some(3000),
receiver_id: "travel_agency",
method_names: [ "reserve_trip", "cancel_trip" ]
}
This scenario might arise when someone Alice's parent has given them a restricted access to alice_near account by
creating an access key that can be used strictly for trip management.
This access key allows up to 3000 tokens to be spent (which includes token transfers and payments for gas), it can
be only used to call travel_agency and it can be only used with the reserve_trip and cancel_trip methods.
The way runtime treats this case is almost exactly the same as the previous one, with the only difference on how it verifies
the signature of on the signed transaction, and that it also checks for allowance to not be exceeded.
Finally, in the last scenario, Alice does not have an account (or the existence of alice_near is irrelevant). However,
alice has full or restricted access key directly on travel_agency account. In that case signer_id == receiver_id in the
Transaction object and runtime will convert transaction to the first receipt and apply that receipt in the same block.
This section will focus on the first scenario, since the other two are the same with some minor differences.
Transaction to receipt
The process of converting transaction to receipt is very similar to the Financial Transaction with several key points to note:
- Since Alice attaches 100 tokens to the function call, we subtract them from
alice_nearupon converting transaction to receipt, similar to the regular financial transaction; - Since we are attaching 1000000 prepaid gas, we will not only subtract the gas costs of processing the receipt from
alice_near, but will also purchase 1000000 gas using the current gas price.
Processing the reserve_trip receipt
The receipt created on the shard that hosts alice_near will eventually arrive to the shard hosting travel_agency account.
It will be processed in Runtime::apply which will check that receipt does not have data dependencies (which is the case because
this function call is not a callback) and will call Runtime::apply_action_receipt.
At this point receipt processing is similar to receipt processing from the Financial Transaction
section, with one difference that we will also call action_function_call which will do the following:
- Retrieve the Wasm code of the smart contract (either from the database or from the cache);
- Initialize runtime context through
VMContextand createRuntimeExtwhich provides access to the trie when the smart contract call the storage API. Specifically"{\"city\": \"Venice\", \"date\": 20191201}"arguments will be set inVMContext. - Calls
near_vm_runner::runwhich does the following:- Inject gas, stack, and other kinds of metering;
- Verify that Wasm code does not use floats;
- Checks that bindings API functions that the smart contract is trying to call are actually those provided by
near_vm_logic; - Compiles Wasm code into the native binary;
- Calls
reserve_tripon the smart contract.- During the execution of the smart contract it will at some point call
promise_createandpromise_then, which will call method onRuntimeExtthat will record that two promises were created and that the second one should wait on the first one. Specifically,promise_createwill callRuntimeExt::create_receipt(vec![], "hotel_near")returning0and thenRuntimeExt::create_receipt(vec![0], "travel_agency");
- During the execution of the smart contract it will at some point call
action_function_callthen collects receipts fromVMContextalong with the execution result, logs, and information about used gas;apply_action_receiptthen goes over the collected receipts from each action and returns them at the end ofRuntime::applytogether with other receipts.
Processing the reserve receipt
This receipt will have output_data_receivers with one element corresponding to the receipt that calls hotel_reservation_complete,
which will tell the runtime that it should create DataReceipt and send it towards travel_agency once the execution of reserve(date: u64) is complete.
The rest of the smart contract execution is similar to the above.
Processing the hotel_reservation_complete receipt
Upon receiving the hotel_reservation_complete receipt the runtime will notice that its input_data_ids is not empty
which means that it cannot be executed until reserve receipt is complete. It will store the receipt in the trie together
with the counter of how many DataReceipt it is waiting on.
It will not call the Wasm smart contract at this point.
Processing the DataReceipt
Once the runtime receives the DataReceipt it takes the receipt with hotel_reservation_complete function call
and executes it following the same execution steps as with the reserve_trip receipt.
Economics
This is under heavy development
Units
| Name | Value |
|---|---|
| yoctoNEAR | smallest indivisible amount of native currency NEAR. |
| NEAR | 10**24 yoctoNEAR |
| block | smallest on-chain unit of time |
| gas | unit to measure usage of blockchain |
General Parameters
| Name | Value |
|---|---|
INITIAL_SUPPLY | 10**33 yoctoNEAR |
MIN_GAS_PRICE | 10**5 yoctoNEAR |
REWARD_PCT_PER_YEAR | 0.025 |
EPOCH_LENGTH | 43,200 blocks |
EPOCHS_A_YEAR | 730 epochs |
INITIAL_MAX_STORAGE | 10 * 2**40 bytes == 10 TB |
TREASURY_PCT | 0.1 |
TREASURY_ACCOUNT_ID | treasury |
CONTRACT_PCT | 0.3 |
INVALID_STATE_SLASH_PCT | 0.05 |
ADJ_FEE | 0.01 |
TOTAL_SEATS | 100 |
ONLINE_THRESHOLD_MIN | 0.9 |
ONLINE_THRESHOLD_MAX | 0.99 |
BLOCK_PRODUCER_KICKOUT_THRESHOLD | 0.8 |
CHUNK_PRODUCER_KICKOUT_THRESHOLD | 0.8 |
CHUNK_VALIDATOR_KICKOUT_THRESHOLD | 0.7 |
General Variables
| Name | Description | Initial value |
|---|---|---|
totalSupply[t] | Total supply of NEAR at given epoch[t] | INITIAL_SUPPLY |
gasPrice[t] | The cost of 1 unit of gas in NEAR tokens (see Transaction Fees section below) | MIN_GAS_PRICE |
storageAmountPerByte[t] | keeping constant, INITIAL_SUPPLY / INITIAL_MAX_STORAGE | ~9.09 * 10**19 yoctoNEAR |
Issuance
The protocol sets a ceiling for the maximum issuance of tokens, and dynamically decreases this issuance depending on the amount of total fees in the system.
| Name | Description |
|---|---|
reward[t] | totalSupply[t] * REWARD_PCT_PER_YEAR * epochTime[t] / NUM_SECONDS_IN_A_YEAR |
epochFee[t] | sum([(1 - DEVELOPER_PCT_PER_YEAR) * block.txFee + block.stateFee for block in epoch[t]]) |
issuance[t] | The amount of token issued at a certain epoch[t], issuance[t] = reward[t] - epochFee[t] |
Where totalSupply[t] is the total number of tokens in the system at a given time t and epochTime[t] is the
duration of the epoch in seconds.
If epochFee[t] > reward[t] the issuance is negative, thus the totalSupply[t] decreases in given epoch.
Transaction Fees
Each transaction before inclusion must buy gas enough to cover the cost of bandwidth and execution.
Gas unifies execution and bytes of bandwidth usage of blockchain. Each WASM instruction or pre-compiled function gets assigned an amount of gas based on measurements on common-denominator computer. Same goes for weighting the used bandwidth based on general unified costs.
Gas is priced dynamically in NEAR tokens. At each block t, we update gasPrice[t] = gasPrice[t - 1] * (1 + (gasUsed[t - 1] / gasLimit[t - 1] - 0.5) * ADJ_FEE).
Where gasUsed[t] = sum([sum([gas(tx) for tx in chunk]) for chunk in block[t]]).
gasLimit[t] is defined as gasLimit[t] = gasLimit[t - 1] + validatorGasDiff[t - 1], where validatorGasDiff is parameter with which each chunk producer can either increase or decrease gas limit based on how long it to execute the previous chunk. validatorGasDiff[t] can be only within ±0.1% of gasLimit[t] and only if gasUsed[t - 1] > 0.9 * gasLimit[t - 1].
State Stake
Amount of NEAR on the account represents right for this account to take portion of the blockchain's overall global state. Transactions fail if account doesn't have enough balance to cover the storage required for given account.
def check_storage_cost(account):
# Compute requiredAmount given size of the account.
requiredAmount = sizeOf(account) * storageAmountPerByte
return Ok() if account.amount + account.locked >= requiredAmount else Error(requiredAmount)
# Check when transaction is received to verify that it is valid.
def verify_transaction(tx, signer_account):
# ...
# Updates signer's account with the amount it will have after executing this tx.
update_post_amount(signer_account, tx)
result = check_storage_cost(signer_account)
# If enough balance OR account is been deleted by the owner.
if not result.ok() or DeleteAccount(tx.signer_id) in tx.actions:
assert LackBalanceForState(signer_id: tx.signer_id, amount: result.err())
# After account touched / changed, we check it still has enough balance to cover it's storage.
def on_account_change(block_height, account):
# ... execute transaction / receipt changes ...
# Validate post-condition and revert if it fails.
result = check_storage_cost(sender_account)
if not result.ok():
assert LackBalanceForState(signer_id: tx.signer_id, amount: result.err())
Where sizeOf(account) includes size of account_id, account structure and size of all the data stored under the account.
Account can end up with not enough balance in case it gets slashed. Account will become unusable as all originating transactions will fail (including deletion). The only way to recover it in this case is by sending extra funds from a different accounts.
Validators
NEAR validators provide their resources in exchange for a reward epochReward[t], where [t] represents the considered epoch
| Name | Description |
|---|---|
epochReward[t] | = coinbaseReward[t] + epochFee[t] |
coinbaseReward[t] | The maximum inflation per epoch[t], as a function of REWARD_PCT_PER_YEAR / EPOCHS_A_YEAR |
Validator Selection
#![allow(unused)] fn main() { struct Proposal { account_id: AccountId, stake: Balance, public_key: PublicKey, } }
During the epoch, outcome of staking transactions produce proposals, which are collected, in the form of Proposals.
There are separate proposals for block producers and chunk-only producers, see Selecting Chunk and Block Producers.
for more information.
At the end of every epoch T, next algorithm gets executed to determine validators for epoch T + 2:
- For every chunk/block producer in
epoch[T]determinenum_blocks_produced,num_chunks_producedbased on what they produced during the epoch. - Remove validators, for whom
num_blocks_produced < num_blocks_expected * BLOCK_PRODUCER_KICKOUT_THRESHOLDornum_chunks_produced < num_chunks_expected * CHUNK_PRODUCER_KICKOUT_THRESHOLD. - Collect chunk-only and block producer
proposals, if validator was also a validator inepoch[T], considered stake of the proposal is0 if proposal.stake == 0 else proposal.stake + reward[proposal.account_id]. - Use the chunk/block producer selection algorithms outlined in Selecting Chunk and Block Producers.
Validator Rewards Calculation
Note: all calculations are done in Rational numbers.
Total reward every epoch t is equal to:
total_reward[t] = floor(totalSupply * max_inflation_rate * epoch_length)
where max_inflation_rate is taken from the epoch config while totalSupply and epoch_length are
taken from the last block in the epoch.
After that a fraction of the reward goes to the treasury and the remaining amount will be used for computing validator rewards:
treasury_reward[t] = floor(reward[t] * protocol_reward_rate)
validator_reward[t] = total_reward[t] - treasury_reward[t]
Validators that didn't meet the threshold for either blocks or chunks get kicked out and don't get any reward, otherwise uptime
of a validator is computed as an average of (block produced/expected, chunk produced/expected,
and chunk endorsements produced/expected) and adjusted wrt the ONLINE_THRESHOLD, ONLINE_THRESHOLD_MIN, ONLINE_THRESHOLD_MAX parameters:
pct_online[t][j] = mean(num_blocks_produced[t][j] / num_blocks_expected[t][j],
num_chunks_produced[t][j] / num_chunks_expected[t][j],
num_endorsements_produced[t][j] / num_endorsements_expected[t][j])
if pct_online > ONLINE_THRESHOLD:
uptime[t][j] = min(1, (pct_online[t][j] - ONLINE_THRESHOLD_MIN) / (ONLINE_THRESHOLD_MAX - ONLINE_THRESHOLD_MIN))
else:
uptime[t][j] = 0
Where expected_produced_blocks and expected_produced_chunks is the number of blocks and chunks respectively that is expected to be produced by given validator j in the epoch t.
The specific validator[t][j] reward for epoch t is then proportional to the fraction of stake of this validator from total stake:
validator_reward[t][j] = floor(uptime[t][j] * stake[t][j] * total_reward[t] / total_stake[t])
Slashing
ChunkProofs
# Check that chunk is invalid, because the proofs in header don't match the body.
def chunk_proofs_condition(chunk):
# TODO
# At the end of the epoch, run update validators and
# determine how much to slash validators.
def end_of_epoch_update_validators(validators):
# ...
for validator in validators:
if validator.is_slashed:
validator.stake -= INVALID_STATE_SLASH_PCT * validator.stake
ChunkState
# Check that chunk header post state root is invalid,
# because the execution of previous chunk doesn't lead to it.
def chunk_state_condition(prev_chunk, prev_state, chunk_header):
# TODO
# At the end of the epoch, run update validators and
# determine how much to slash validators.
def end_of_epoch(..., validators):
# ...
for validator in validators:
if validator.is_slashed:
validator.stake -= INVALID_STATE_SLASH_PCT * validator.stake
Protocol Treasury
Treasury account TREASURY_ACCOUNT_ID receives fraction of reward every epoch t:
# At the end of the epoch, update treasury
def end_of_epoch(..., reward):
# ...
accounts[TREASURY_ACCOUNT_ID].amount = treasury_reward[t]
Contract Rewards
Contract account is rewarded with 30% of gas burnt during the execution of its functions.
The reward is credited to the contract account after applying the corresponding receipt with FunctionCallAction, gas is converted to tokens using gas price of the current block.
You can read more about:
- receipts execution;
- runtime fees with description how gas is charged.
GenesisConfig
protocol_version
type: u32
Protocol version that this genesis works with.
genesis_time
type: DateTime
Official time of blockchain start.
genesis_height
type: u64
Height of the genesis block. Note that genesis height is not necessarily 0.
For example, mainnet genesis height is 9820210.
chain_id
type: String
ID of the blockchain. This must be unique for every blockchain. If your testnet blockchains do not have unique chain IDs, you will have a bad time.
num_block_producers
type: u32
Number of block producer seats at genesis.
block_producers_per_shard
type: [ValidatorId]
Defines number of shards and number of validators per each shard at genesis.
avg_fisherman_per_shard
type: [ValidatorId]
Expected number of fisherman per shard.
dynamic_resharding
type: bool
Enable dynamic re-sharding.
epoch_length
type: BlockIndex
Epoch length counted in blocks.
gas_limit
type: Gas
Initial gas limit for a block
gas_price
type: Balance
Initial gas price
block_producer_kickout_threshold
type: u8
Criterion for kicking out block producers (this is a number between 0 and 100)
chunk_producer_kickout_threshold
type: u8
Criterion for kicking out chunk producers (this is a number between 0 and 100)
gas_price_adjustment_rate
type: Fraction
Gas price adjustment rate
runtime_config
type: RuntimeConfig
Runtime configuration (mostly economics constants).
validators
type: [AccountInfo]
List of initial validators.
records
type: Vec<StateRecord>
Records in storage at genesis (get split into shards at genesis creation).
transaction_validity_period
type: u64
Number of blocks for which a given transaction is valid
developer_reward_percentage
type: Fraction
Developer reward percentage.
protocol_reward_percentage
type: Fraction
Protocol treasury percentage.
max_inflation_rate
type: Fraction
Maximum inflation on the total supply every epoch.
total_supply
type: Balance
Total supply of tokens at genesis.
num_blocks_per_year
type: u64
Expected number of blocks per year
protocol_treasury_account
type: AccountId
Protocol treasury account
protocol economics
For the specific economic specs, refer to Economics Section.
ExtCostsConfig
base
type: Gas
Base cost for calling a host function.
read_memory_base
type: Gas
Base cost for guest memory read
read_memory_byte
type: Gas
Cost for guest memory read
write_memory_base
type: Gas
Base cost for guest memory write
write_memory_byte
type: Gas
Cost for guest memory write per byte
read_register_base
type: Gas
Base cost for reading from register
read_register_byte
type: Gas
Cost for reading byte from register
write_register_base
type: Gas
Base cost for writing into register
write_register_byte
type: Gas
Cost for writing byte into register
utf8_decoding_base
type: Gas
Base cost of decoding utf8.
utf8_decoding_byte
type: Gas
Cost per bye of decoding utf8.
utf16_decoding_base
type: Gas
Base cost of decoding utf16.
utf16_decoding_byte
type: Gas
Cost per bye of decoding utf16.
sha256_base
type: Gas
Cost of getting sha256 base
sha256_byte
type: Gas
Cost of getting sha256 per byte
keccak256_base
type: Gas
Cost of getting keccak256 base
keccak256_byte
type: Gas
Cost of getting keccak256 per byte
keccak512_base
type: Gas
Cost of getting keccak512 base
keccak512_byte
type: Gas
Cost of getting keccak512 per byte
log_base
type: Gas
Cost for calling logging.
log_byte
type: Gas
Cost for logging per byte
Storage API
storage_write_base
type: Gas
Storage trie write key base cost
storage_write_key_byte
type: Gas
Storage trie write key per byte cost
storage_write_value_byte
type: Gas
Storage trie write value per byte cost
storage_write_evicted_byte
type: Gas
Storage trie write cost per byte of evicted value.
storage_read_base
type: Gas
Storage trie read key base cost
storage_read_key_byte
type: Gas
Storage trie read key per byte cost
storage_read_value_byte
type: Gas
Storage trie read value cost per byte cost
storage_remove_base
type: Gas
Remove key from trie base cost
storage_remove_key_byte
type: Gas
Remove key from trie per byte cost
storage_remove_ret_value_byte
type: Gas
Remove key from trie ret value byte cost
storage_has_key_base
type: Gas
Storage trie check for key existence cost base
storage_has_key_byte
type: Gas
Storage trie check for key existence per key byte
storage_iter_create_prefix_base
type: Gas
Create trie prefix iterator cost base
storage_iter_create_prefix_byte
type: Gas
Create trie prefix iterator cost per byte.
storage_iter_create_range_base
type: Gas
Create trie range iterator cost base
storage_iter_create_from_byte
type: Gas
Create trie range iterator cost per byte of from key.
storage_iter_create_to_byte
type: Gas
Create trie range iterator cost per byte of to key.
storage_iter_next_base
type: Gas
Trie iterator per key base cost
storage_iter_next_key_byte
type: Gas
Trie iterator next key byte cost
storage_iter_next_value_byte
type: Gas
Trie iterator next key byte cost
touching_trie_node
type: Gas
Cost per touched trie node
Promise API
promise_and_base
type: Gas
Cost for calling promise_and
promise_and_per_promise
type: Gas
Cost for calling promise_and for each promise
promise_return
type: Gas
Cost for calling promise_return
VMConfig
Config of wasm operations.
ext_costs
type: [ExtCostsConfig] ExtCostsConfig
Costs for runtime externals
grow_mem_cost
`type: u32
Gas cost of a growing memory by single page.
regular_op_cost
`type: u32
Gas cost of a regular operation.
linear_op_base_cost
`type: u64
Base gas cost of a bulk memory/table operation.
linear_op_unit_cost
`type: u64
Gas cost per unit of a bulk memory/table operation.
max_gas_burnt
`type: Gas
Max amount of gas that can be used, excluding gas attached to promises.
max_stack_height
`type: u32
How tall the stack is allowed to grow?
initial_memory_pages
`type: u32
max_memory_pages
`type: u32
The initial number of memory pages. What is the maximal memory pages amount is allowed to have for a contract.
registers_memory_limit
`type: u64
Limit of memory used by registers.
max_register_size
`type: u64
Maximum number of bytes that can be stored in a single register.
max_number_registers
`type: u64
Maximum number of registers that can be used simultaneously.
max_number_logs
`type: u64
Maximum number of log entries.
max_log_len
`type: u64
Maximum length of a single log, in bytes.
StateRecord
type: Enum
Enum that describes one of the records in the state storage.
Account
type: Unnamed struct
Record that contains account information for a given account ID.
account_id
type: AccountId
The account ID of the account.
account
type: Account
The account structure. Serialized to JSON. U128 types are serialized to strings.
Data
type: Unnamed struct
Record that contains key-value data record for a contract at the given account ID.
account_id
type: AccountId
The account ID of the contract that contains this data record.
data_key
type: Vec<u8>
Data Key serialized in Base64 format.
NOTE: Key doesn't contain the data separator.
value
type: Vec<u8>
Value serialized in Base64 format.
Contract
type: Unnamed struct
Record that contains a contract code for a given account ID.
account_id
type: AccountId
The account ID of that has the contract.
code
type: Vec<u8>
WASM Binary contract code serialized in Base64 format.
AccessKey
type: Unnamed struct
Record that contains an access key for a given account ID.
account_id
type: AccountId
The account ID of the access key owner.
public_key
type: PublicKey
The public key for the access key in JSON-friendly string format. E.g. ed25519:5JFfXMziKaotyFM1t4hfzuwh8GZMYCiKHfqw1gTEWMYT
access_key
type: AccessKey
The access key serialized in JSON format.
PostponedReceipt
type: Box<Receipt> Receipt
Record that contains a receipt that was postponed on a shard (e.g. it's waiting for incoming data).
The receipt is in JSON-friendly format. The receipt can only be an ActionReceipt.
NOTE: Box is used to decrease fixed size of the entire enum.
ReceivedData
type: Unnamed struct
Record that contains information about received data for some action receipt, that is not yet received or processed for a given account ID.
The data is received using DataReceipt before. See Receipts for details.
account_id
type: AccountId
The account ID of the receiver of the data.
data_id
type: CryptoHash
Data ID of the data in base58 format.
data
type: Option<Vec<u8>>
Optional data encoded as base64 format or null in JSON.
DelayedReceipt
type: Box<Receipt> Receipt
Record that contains a receipt that was delayed on a shard. It means the shard was overwhelmed with receipts and it processes receipts from backlog. The receipt is in JSON-friendly format. See Delayed Receipts for details.
NOTE: Box is used to decrease fixed size of the entire enum.
RuntimeConfig
The structure that holds the parameters of the runtime, mostly economics.
storage_cost_byte_per_block
type: Balance
The cost to store one byte of storage per block.
storage_cost_byte_per_block
type: Balance
Costs of different actions that need to be performed when sending and processing transaction and receipts.
poke_threshold
type: BlockIndex
The minimum number of blocks of storage rent an account has to maintain to prevent forced deletion.
transaction_costs
type: RuntimeFeesConfig RuntimeFeesConfig
Costs of different actions that need to be performed when sending and processing transaction and receipts.
wasm_config
type: VMConfig VMConfig
Config of wasm operations.
account_length_baseline_cost_per_block
type: Balance
The baseline cost to store account_id of short length per block.
The original formula in NEP#0006 is 1,000 / (3 ^ (account_id.length - 2)) for cost per year.
This value represents 1,000 above adjusted to use per block
RuntimeFeesConfig
Economic parameters for runtime
action_receipt_creation_config
type: Fee
Describes the cost of creating an action receipt, ActionReceipt, excluding the actual cost
of actions.
data_receipt_creation_config
type: DataReceiptCreationConfig
Describes the cost of creating a data receipt, DataReceipt.
action_creation_config
type: ActionCreationConfig
Describes the cost of creating a certain action, Action. Includes all variants.
storage_usage_config
type: StorageUsageConfig
Describes fees for storage rent
burnt_gas_reward
type: Fraction
Fraction of the burnt gas to reward to the contract account for execution.
AccessKeyCreationConfig
Describes the cost of creating an access key.
full_access_cost
type: Fee Base cost of creating a full access access-key.
function_call_cost
type: Fee Base cost of creating an access-key restricted to specific functions.
function_call_cost_per_byte
type: Fee Cost per byte of method_names of creating a restricted access-key.
action_creation_config
Describes the cost of creating a specific action, Action. Includes all variants.
create_account_cost
type: Fee
Base cost of creating an account.
deploy_contract_cost
type: Fee
Base cost of deploying a contract.
deploy_contract_cost_per_byte
type: Fee
Cost per byte of deploying a contract.
function_call_cost
type: Fee
Base cost of calling a function.
function_call_cost_per_byte
type: Fee
Cost per byte of method name and arguments of calling a function.
transfer_cost
type: Fee
Base cost of making a transfer.
NOTE: If the account ID is an implicit account ID (64-length hex account ID), then the cost of the transfer fee
will be transfer_cost + create_account_cost + add_key_cost.full_access_cost.
This is needed to account for the implicit account creation costs.
stake_cost
type: Fee
Base cost of staking.
add_key_cost
type: AccessKeyCreationConfig Base cost of adding a key.
delete_key_cost
type: Fee
Base cost of deleting a key.
delete_account_cost
type: Fee
Base cost of deleting an account.
DataReceiptCreationConfig
Describes the cost of creating a data receipt, DataReceipt.
base_cost
type: Fee Base cost of creating a data receipt.
cost_per_byte
type: Fee Additional cost per byte sent.
Fee
Costs associated with an object that can only be sent over the network (and executed by the receiver).
send_sir
Fee for sending an object from the sender to itself, guaranteeing that it does not leave (SIR = signer is receiver, which guarantees the receipt is local).
send_not_sir
Fee for sending an object potentially across the shards.
execution
Fee for executing the object.
Fraction
numerator
type: u64
denominator
type: u64
StorageUsageConfig
Describes cost of storage per block
account_cost
type: Gas Base storage usage for an account
data_record_cost
type: Gas Base cost for a k/v record
key_cost_per_byte
type: Gas Cost per byte of key
value_cost_per_byte: Gas
type: Gas Cost per byte of value
code_cost_per_byte: Gas
type: Gas Cost per byte of contract code
Overview
This document describes the high-level architecture of nearcore. The focus here is on the implementation of the blockchain protocol, not the protocol itself. For reference documentation of the protocol, please refer to nomicon
Some parts of our architecture are also covered in this video series on YouTube.
Bird's Eye View
If we put the entirety of nearcore onto one picture, we get something like this:

Don't worry if this doesn't yet make a lot of sense: hopefully, by the end of this document the above picture would become much clearer!
Overall Operation
nearcore is a blockchain node -- it's a single binary (neard) which runs on
some machine and talks to other similar binaries running elsewhere. Together,
the nodes agree (using a distributed consensus algorithm) on a particular
sequence of transactions. Once transaction sequence is established, each node
applies transactions to the current state. Because transactions are fully
deterministic, each node in the network ends up with identical state. To allow
greater scalability, NEAR protocol uses sharding, which allows a node to hold
only a small subset (shard) of the whole state.
neard is a stateful, restartable process. When neard starts, the node
connects to the network and starts processing blocks (block is a batch of
transactions, processed together; transactions are batched into blocks for
greater efficiency). The results of processing are persisted in the database.
RocksDB is used for storage. Usually, the node's data is found in the ~/.near
directory. The node can be stopped at any moment and be restarted later. While
the node is offline it misses the block, so, after a restart, the sync process
kicks in which brings the node up-to-speed with the network by downloading the
missing bits of history from more up-to-date peer nodes.
Major components of nearcore:
-
JSON RPC. This HTTP RPC interface is how
neardcommunicates with non-blockchain outside world. For example, to submit a transaction, some client sends an RPC request with it to some node in the network. From that node, the transaction propagates through the network, until it is included in some block. Similarly, a client can send an HTTP request to a node to learn about current state of the blockchain. The JSON RPC interface is documented here. -
Network. If RPC is aimed "outside" the blockchain, "network" is how peer
neardnodes communicate with each other within the blockchain. RPC carries requests from users of the blockchain, while network carries various messages needed to implement consensus. Two directly connected nodes communicate by sending protobuf-encoded messages over TCP. A node also includes logic to route messages for indirect peers through intermediaries. Oversimplifying a lot, it's enough for a new node to know an IP address of just one other network participant. From this bootstrap connection, the node learns how to communicate with any other node in the network. -
Client. Somewhat confusingly named, client is the logical state of the blockchain. After receiving and decoding a request, both RPC and network usually forward it in the parsed form to the client. Internally, client is split in two somewhat independent components: chain and runtime.
-
Chain. The job of chain, in a nutshell, is to determine a global order of transactions. Chain builds and maintains the blockchain data structure. This includes block and chunk production and processing, consensus, and validator selection. However, chain is not responsible for actually applying transactions and receipts.
-
Runtime. If chain selects the order of transactions, Runtime applies transaction to the state. Chain guarantees that everyone agrees on the order and content of transactions, and Runtime guarantees that each transaction is fully deterministic. It follows that everyone agrees on the "current state" of the blockchain. Some transactions are as simple as "transfer X tokens from Alice to Bob". But a much more powerful class of transactions is supported: "run this arbitrary WebAssembly code in the context of the current state of the chain". Running such "smart contract" transactions securely and efficiently is a major part of what Runtime does. Today, Runtime uses a JIT compiler to do that.
-
Storage. Storage is more of a cross-cutting concern, than an isolated component. Many parts of a node want to durably persist various bits of state to disk. One notable case is the logical state of the blockchain, and, in particular, data associated with each account. Logically, the state of an account on a chain is a key-value map:
HashMap<Vec<u8>, Vec<u8>>. But there is a twist: it should be possible to provide a succinct proof that a particular key indeed holds a particular value. To allow that internally the state is implemented as a persistent (in both senses, "functional" and "on disk") merkle-patricia trie. -
Parameter Estimator. One kind of transaction we support is "run this arbitrary, Turing-complete computation". To protect from a
loop {}transaction halting the whole network, Runtime implements resource limiting: each transaction runs with a certain finite amount of "gas", and each operation costs a certain amount of gas to perform. Parameter estimator is essentially a set of benchmarks used to estimate relative gas costs of various operations.
Entry Points
neard/src/main.rs contains the main function that starts a blockchain node.
However, this file mostly only contains the logic to parse arguments and
dispatch different commands. start_with_config in nearcore/src/lib.rs is the
actual entry point and it starts all the actors.
JsonRpcHandler::process in the jsonrpc crate is the RPC entry point. It
implements the public API of a node, which is documented
here.
PeerManagerActor::spawn in the network is an entry for the other point of
contract with the outside world -- the peer-to-peer network.
Runtime::apply in the runtime crate is the entry point for transaction
processing logic. This is where state transitions actually happen, after chain
decided, according to distributed consensus, which transitions need to
happen.
Code Map
This section contains some high-level overview of important crates and data structures.
core/primitives
This crate contains most of the types that are shared across different crates.
core/primitives-core
This crate contains types needed for runtime.
core/store/trie
This directory contains the MPT state implementation. Note that we usually use
TrieUpdate to interact with the state.
chain/chain
This crate contains most of the chain logic (consensus, block processing, etc).
ChainUpdate::process_block is where most of the block processing logic
happens.
State update
The blockchain state of a node can be changed in the following two ways:
- Applying a chunk. This is how the state is normally updated: through
Runtime::apply. - State sync. State sync can happen in two cases:
- A node is far enough behind the most recent block and triggers state sync to fast forward to the state of a very recent block without having to apply blocks in the middle.
- A node is about to become validator for some shard in the next epoch, but it
does not yet have the state for that shard. In this case, it would run state
sync through the
catchuproutine.
chain/chunks
This crate contains most of the sharding logic which includes chunk creation,
distribution, and processing. ShardsManager is the main struct that
orchestrates everything here.
chain/client
This crate defines two important structs, Client and ViewClient. Client
includes everything necessary for the chain (without network and runtime) to
function and runs in a single thread. ViewClient is a "read-only" client that
answers queries without interfering with the operations of Client.
ViewClient runs in multiple threads.
chain/network
This crate contains the entire implementation of the p2p network used by NEAR blockchain nodes.
Two important structs here: PeerManagerActor and Peer. Peer manager
orchestrates all the communications from network to other components and from
other components to network. Peer is responsible for low-level network
communications from and to a given peer (more details in
this article). Peer manager runs in one thread while each
Peer runs in its own thread.
Architecture Invariant: Network communicates to Client through
NetworkClientMessages and to ViewClient through NetworkViewClientMessages.
Conversely, Client and ViewClient communicates to network through
NetworkRequests.
chain/epoch_manager
This crate is responsible for determining validators and other epoch related information such as epoch id for each epoch.
Note: EpochManager is constructed in NightshadeRuntime rather than in
Chain, partially because we had this idea of making epoch manager a smart
contract.
chain/jsonrpc
This crate implements JSON-RPC API server to enable
submission of new transactions and inspection of the blockchain data, the
network state, and the node status. When a request is processed, it generates a
message to either ClientActor or ViewClientActor to interact with the
blockchain. For queries of blockchain data, such as block, chunk, account, etc,
the request usually generates a message to ViewClientActor. Transactions, on
the other hand, are sent to ClientActor for further processing.
runtime/runtime
This crate contains the main entry point to runtime -- Runtime::apply. This
function takes ApplyState, which contains necessary information passed from
chain to runtime, a list of SignedTransaction and a list of Receipt, and
returns an ApplyResult, which includes state changes, execution outcomes, etc.
Architecture Invariant: The state update is only finalized at the end of
apply. During all intermediate steps state changes can be reverted.
runtime/near-vm-logic
VMLogic contains all the implementations of host functions and is the
interface between runtime and wasm. VMLogic is constructed when runtime
applies function call actions. In VMLogic, interaction with NEAR blockchain
happens in the following two ways:
VMContext, which contains lightweight information such as current block hash, current block height, epoch id, etc.External, which is a trait that contains functions to interact with blockchain by either reading some nontrivial data, or writing to the blockchain.
runtime/near-vm-runner
run function in runner.rs is the entry point to the vm runner. This function essentially spins
up the vm and executes some function in a contract. Contracts are compiled and run with wasmtime.
The imports module exposes host functions defined in near-vm-logic to WASM code. In other
words, it defines the ABI of the contracts on NEAR.
neard
As mentioned before, neard is the crate that contains that main entry points.
All the actors are spawned in start_with_config. It is also worth noting that
NightshadeRuntime is the struct that implements RuntimeAdapter.
core/store/src/db.rs
This file contains the schema (DBCol) of our internal RocksDB storage - a good starting point when reading the code base.
Cross Cutting Concerns
Observability
The tracing crate is used for structured, hierarchical event output and logging. We also integrate Prometheus for light-weight metric output. See the style documentation for more information on the usage.
Testing
Rust has built-in support for writing unit tests by marking functions
with the #[test] directive. Take full advantage of that! Testing not
only confirms that what was written works the way it was intended to but
also helps during refactoring since it catches unintended behavior
changes.
Not all tests are created equal though and while some may only need
milliseconds to run, others may run for several seconds or even
minutes. Tests that take a long time should be marked as such by
prefixing their name with slow_test_ or ultra_slow_test_:
#![allow(unused)] fn main() { #[test] fn ultra_slow_test_catchup_random_single_part_sync() { test_catchup_random_single_part_sync_common(false, false, 13) } }
During local development both slow and ultra-slow tests will not run
with a typical just nextest invocation. You can run them with just nextest-slow or just nextest-all locally. CI will run the slow
tests and the ultra_slow ones are left to run on Nayduck.
Because ultra_slow tests are run on nayduck, they need to be explicitly
included in nightly/expensive.txt file; for example:
expensive --timeout=1800 near-client near_client tests::catching_up::ultra_slow_test_catchup_random_single_part_sync
expensive --timeout=1800 near-client near_client tests::catching_up::ultra_slow_test_catchup_random_single_part_sync --features nightly
expensive --timeout=1800 near-client near_client tests::catching_up::ultra_slow_test_catchup_random_single_part_sync --features nightly,protocol_feature_spice
For more details regarding nightly tests see nightly/README.md.
Note that what counts as a slow test is defined in
.config/nextest.toml.
How neard works
This chapter describes how neard works with a focus on implementation details and practical scenarios. To get a better understanding of how the protocol works, please refer to nomicon. For a high-level code map of nearcore, please refer to this document.
High level overview
On the high level, neard is a daemon that periodically receives messages from the network and sends messages to peers based on different triggers. Neard is implemented using an actor framework provided by near-async.
There are several important actors in neard:
-
PeerActor- Each peer is represented by one peer actor and runs in a separate thread. It is responsible for sending messages to and receiving messages from a given peer. AfterPeerActorreceives a message, it will route it toClientActor,ViewClientActor, orPeerManagerActordepending on the type of the message. -
PeerManagerActor- Peer Manager is responsible for receiving messages to send to the network from eitherClientActororViewClientActorand routing them to the rightPeerActorto send the bytes over the wire. It is also responsible for handling some types of network messages received and routed throughPeerActor. For the purpose of this document, we only need to know thatPeerManagerActorhandlesRoutedMessages. Peer manager would decide whether theRoutedMessages should be routed toClientActororViewClientActor. -
ClientActor- Client actor is the “core” of neard. It contains all the main logic including consensus, block and chunk processing, state transition, garbage collection, etc. Client actor is single-threaded. -
ViewClientActor- View client actor can be thought of as a read-only interface to client. It only accesses data stored in a node’s storage and does not mutate any state. It is used for two purposes:- Answering RPC requests by fetching the relevant piece of data from storage.
- Handling some network requests that do not require any changes to the storage, such as header sync, state sync, and block sync requests.
ViewClientActorruns in four threads by default but this number is configurable.
Data flow within neard
Flow for incoming messages:

Flow for outgoing messages:
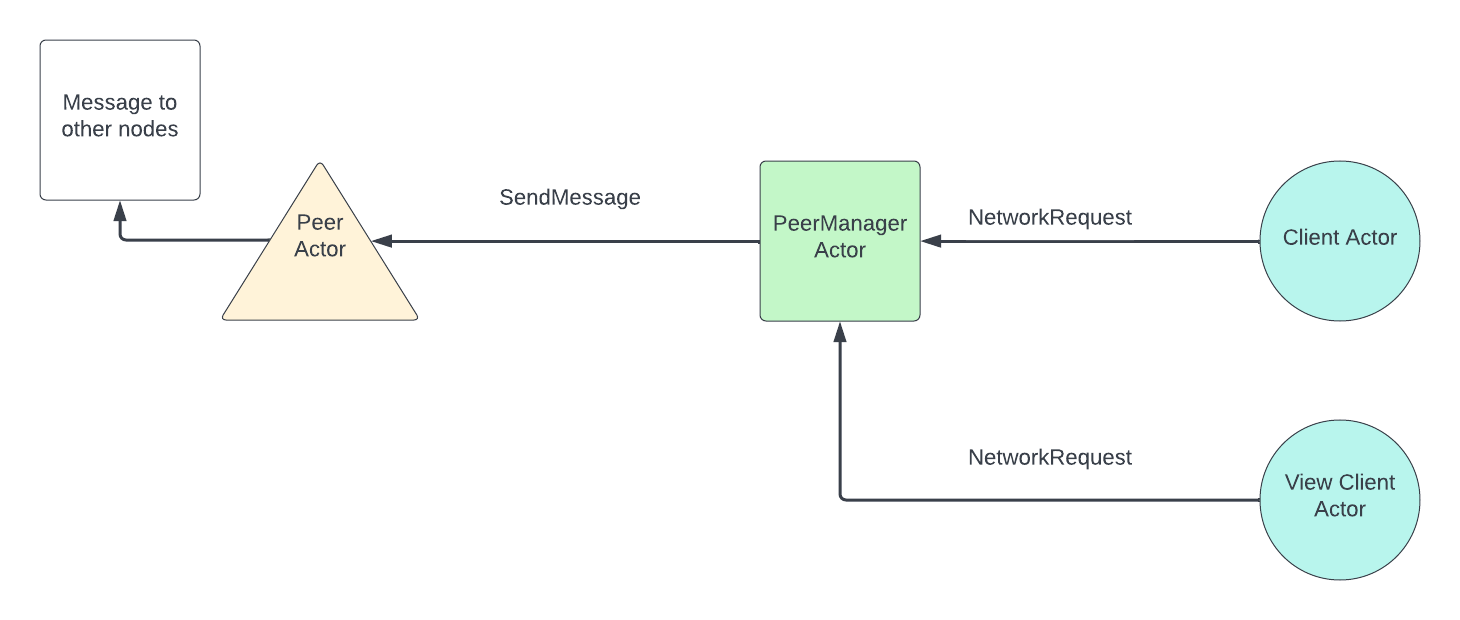
How neard operates when it is fully synced
When a node is fully synced, the main logic of the node operates in the following way (the node is assumed to track all shards, as most nodes on mainnet do today):
- A block is produced by some block producer and sent to the node through broadcasting.
- The node receives a block and tries to process it. If the node is synced it presumably has the previous block and the state before the current block to apply. It then checks whether it has all the chunks available. If the node is not a validator node, it won’t have any chunk parts and therefore won’t have the chunks available. If the node is a validator node, it may already have chunk parts through chunk parts forwarding from other nodes and therefore may have already reconstructed some chunks. Regardless, if the node doesn’t have all chunks for all shards, it will request them from peers by parts.
- The chunk requests are sent and the node waits for enough chunk parts to be
received to reconstruct the chunks. For each chunk, 1/3 of all the parts
(100) is sufficient to reconstruct a chunk. If new blocks arrive while waiting
for chunk parts, they will be put into an
OrphanPool, waiting to be processed. If a chunk part request is not responded to withinchunk_request_retry_period, which is set to 400ms by default, then a request for the same chunk part would be sent again. - After all chunks are reconstructed, the node processes the current block by applying transactions and receipts from the chunks. Afterwards, it will update the head according to the fork choice rule, which only looks at block height. In other words, if the newly processed block is of higher height than the current head of the node, the head is updated.
- The node checks whether any blocks in the
OrphanPoolare ready to be processed in a BFS order and processes all of them until none can be processed anymore. Note that a block is put into theOrphanPoolif and only if its previous block is not accepted. - Upon acceptance of a block, the node would check whether it needs to run garbage collection. If it needs to, it would garbage collect two blocks worth of data at a time. The logic of garbage collection is complicated and could be found here.
- If the node is a validator node, it would start a timer after the current
block is accepted. After
min_block_production_delaywhich is currently configured to be 1.3s on mainnet, it would send an approval to the block producer of the next block (current block height + 1).
The main logic is illustrated below:

How neard works when it is synchronizing
PeerManagerActor periodically sends a NetworkInfo message to ClientActor
to update it on the latest peer information, which includes the height of each
peer. Once ClientActor realizes that it is behind the highest height among
peers, it starts to sync.
The sync handler classifies the node into one of two categories based on how far behind it is:
-
Near horizon (within ~2-3 epochs of the tip). The node enters block sync directly. Header sync and block sync run together on every tick — header sync extends the chain of known headers while block sync follows it, requesting up to 10 blocks at a time. The node has recent enough state to apply blocks as they arrive, so no state sync is needed.
-
Far horizon (more than ~2-3 epochs behind). The node follows the full pipeline:
- Epoch sync: downloads a light-client proof that bootstraps the node to a recent epoch, skipping potentially millions of block headers.
- Header sync: downloads block headers from the epoch sync boundary forward, up to 512 headers at a time, until a valid state sync hash is found.
- State sync: downloads the full state snapshot at the sync hash (near the beginning of a recent epoch). For each tracked shard, state parts are downloaded from peers and assembled into the full state.
- Block sync: downloads and applies blocks from the sync point to the tip, with header sync running alongside.
If a non-genesis node needs epoch sync (it was running before but fell too far behind), the node writes a data reset marker, shuts down, and restarts fresh — wiping stale DB data before re-entering the far-horizon path.
For more details, see the sync documentation.
Note: when a block is received and its height is no more than 500 + the node’s current head height, the node requests its previous block automatically. This is called orphan sync and helps speed up the syncing process. If the height is more than 500 + the node’s current head height, the block is dropped.
How ClientActor works
ClientActor has some periodically running routines that are worth noting:
- Doomslug
timer -
This routine runs every
doomslug_step_period(set to 10ms by default) and updates consensus information. If the node is a validator node, it also sends approvals when necessary. - Block
production -
This routine runs every
block_production_tracking_delay(which is set to 10ms by default) and checks if the node should produce a block. - Log summary - Prints a log line that summarizes block rate, average gas used, the height of the node, etc. every 10 seconds.
- Resend chunk
requests -
This routine runs every
chunk_request_retry_period(which is set to 400ms). It resend the chunk part requests for those that are not yet responded to. - Sync -
This routine runs every
sync_step_period(which is set to 10ms by default) and checks whether the node needs to sync from its peers and, if needed, also starts the syncing process. - Catch
up -
This routine runs every
catchup_step_period(which is set to 100ms by default) and runs the catch up process. This only applies if a node validates shard A in epoch X and is going to validate a different shard B in epoch X+1. In this case, the node would start downloading the state for shard B at the beginning of epoch X. After the state downloading is complete, it would apply all blocks in the current epoch (epoch X) for shard B to ensure that the node has the state needed to validate shard B when epoch X+1 starts.
How Sync Works
Basics
While sync and catchup sound similar, they describe two completely different things.
Sync is used when your node falls behind other nodes in the network (for example because it was down for some time or it took longer to process some blocks).
Catchup is used when you want (or have to) start caring about (a.k.a. tracking) additional shards in future epochs.
Tracking shards: our system has multiple shards. Validators must validate chunks from all shards, but other nodes may track only a subset. Shard tracking changes across epochs as the protocol rebalances assignments, making catchup a regular part of normal operation.
Sync
If your node is behind the head, it starts the sync process. This runs
periodically in the client actor — if the node is behind by more than
sync_height_threshold (default 1) blocks, sync is enabled.
The sync handler classifies the node into one of two categories based on how far behind it is, and routes it through the appropriate path.
The two horizons
┌───────────────┐
│ Sync Needed │
└────────┬──────┘
│
▼
┌──────────────┐
│ Need epoch │
│ sync? │
└───┬───────┬──┘
│ │
yes │ │ no
▼ │
┌────────────┐ │
│ EpochSync │ │
└──────┬─────┘ │
│ │
▼ │
┌────────────┐ │
│ HeaderSync │ │
└──────┬─────┘ │
│ │
▼ │
┌────────────┐ │
│ StateSync │ │
└──────┬─────┘ │
│ │
▼ ▼
┌───────────────────┐
│ BlockSync │
│ (+ header sync) │
└─────────┬─────────┘
│
▼
┌─────────────────┐
│ NoSync (Done) │
└─────────────────┘
The threshold is epoch_sync_horizon_num_epochs (default 2, configurable). This
must not exceed gc_num_epochs_to_keep (minimum 3, default 5) — otherwise a
near-horizon node could need blocks that peers have already garbage collected.
The decision is based on the node's block head (last fully processed block), not header head. Archival nodes always take the near-horizon path regardless of how far behind they are — they need the full block history and cannot use epoch sync. This means an archival node that falls far behind will do header + block sync over the entire gap, which can be slow.
The entry decision is made once when sync starts. It is not re-evaluated during sync — the current path completes naturally.
Far horizon: full pipeline
When the node is too far behind for block-by-block sync, it follows the full pipeline:
Step 1: epoch sync
Epoch sync is a lightweight mechanism that bootstraps a node to a recent epoch without downloading every block header in the chain. Instead of syncing headers one-by-one across potentially millions of blocks, the node downloads a single epoch sync proof that contains just enough information to verify the chain of block producers from genesis to a recent epoch.
The proof is structured inductively: genesis epoch's block producers are known,
and each subsequent epoch's producers are verified via next_bp_hash from the
previous epoch's last final block. The proof contains one
EpochSyncProofEpochData entry per epoch (block producers, last final block
header, endorsements) plus extra data for the last two epochs.
Nodes maintain the epoch sync proof incrementally — at the beginning of every
epoch, the proof is extended by one epoch and stored in compressed form. When a
peer requests a proof, the node returns the pre-computed proof directly without
any on-the-fly derivation. The proof targets epoch T-2 (not T-1) because
transaction_validity_period requires approximately two epochs worth of block
headers for transaction validation. Proofs older than 3 epochs are rejected
by the receiving node (this bound matches MIN_GC_NUM_EPOCHS_TO_KEEP).
Archival nodes skip epoch sync entirely, since they need the full history.
Step 2: header sync
After epoch sync, the node downloads block headers from the epoch sync boundary forward. This is needed to find a valid state sync hash for the current epoch. Headers are requested in batches of up to 512 at a time.
Header sync continues until the header chain is close to the network tip (within ~50 blocks).
Step 3: state sync
After headers are synced, the node downloads the full state snapshot at a sync hash (near the beginning of the most recent epoch). For each shard the node tracks, it downloads state parts from peers and assembles the full state.
State sync creates a gap in the chain data on this node — blocks between the epoch sync boundary and the sync point are not processed. This is fine for non-archival nodes, as that data would be garbage collected after a few epochs anyway.
This step never runs on archival nodes — they need the complete history and cannot have gaps.
If state sync takes too long and the network advances past the sync hash's epoch, state parts become unavailable from peers. When the node detects this (the network tip is more than one epoch ahead of the sync hash), it triggers the same data-reset-and-restart flow used for stale nodes.
Step 4: block sync
The final step downloads and applies blocks from the sync point to the network tip. Header sync runs alongside block sync on every tick. Block sync requests up to 10 blocks at a time.
After each block is received, the node executes the standard block processing path (see section below). When the node's head reaches the highest known height, sync is complete.
Near horizon: block sync
When the node is close enough to the network tip, it enters the block sync phase directly — the same final step as the far-horizon pipeline above. Header sync and block sync run together on every tick, and the node has recent enough state to apply blocks as they arrive. No epoch sync or state sync is needed.
Stale node handling
A "stale node" is a non-genesis node that was running but fell far enough behind to need epoch sync (e.g., it was offline for days). Such a node has stale data in its DB that is incompatible with the epoch sync bootstrapping process.
The node handles this by:
- Downloading and validating the epoch sync proof
- Writing a
.EPOCH_SYNC_DATA_RESETmarker file - Shutting down actors and re-executing the process (via
execon Unix; on non-Unix platforms, the operator must restart manually) - On the new startup, the marker is detected, the data directory is wiped, and the node starts fresh on the far-horizon path from genesis
Restart recovery
If a node crashes mid-sync (e.g., during state sync on the far-horizon path), the handler detects the situation on restart. If an epoch sync proof exists on disk and the node's head is still at genesis, the handler checks whether the header head is within the epoch sync horizon: if so, it re-enters at header sync (headers are already downloaded); if not, it redoes epoch sync with a fresh proof. Previously downloaded state parts are preserved in the DB, so the node does not re-download parts that were already saved before the crash.
Side topic: how blocks are added to the chain?
A node can receive a Block in two ways:
- Either by broadcasting — when a new block is produced, its contents are broadcasted within the network by the nodes
- Or by explicitly sending a BlockRequest to another peer and getting a Block in return.
(In case of broadcasting, the node will automatically reject any Blocks that
are more than 500 (BLOCK_HORIZON) blocks away from the current HEAD).
When a given block is received, the node checks if it can be added to the current chain.
If block's "parent" (prev_block) is not in the chain yet, the block gets
added to the orphan list.
If the parent is already in the chain, we can try to add the block as the head of the chain.
Before adding the block, we want to download the chunks for the shards that we
are tracking, so in many cases, we'll call missing_chunks functions that will
try to go ahead and request those chunks.
Note: as an optimization, we're also sometimes trying to fetch chunks for
the blocks that are in the orphan pool — but only if they are not more than 3
(NUM_ORPHAN_ANCESTORS_CHECK) blocks away from our head.
We also keep a separate job in client_actor that keeps retrying chunk fetching from other nodes if the original request fails.
After all the chunks for a given block are received (we have a separate HashMap that checks how many chunks are missing for each block), we're ready to process the block and attach it to the chain.
Afterwards, we look at other entries in the orphan pool to see if any of them are a direct descendant of the block that we just added, and if yes, we repeat the process.
Catchup
The goal of catchup
Catchup is needed when not all nodes in the network track all shards and nodes can change the shard they are tracking during different epochs.
For example, if a node tracks shard 0 at epoch T and tracks shard 1 at epoch T+1, it actually needs to have the state of shard 1 ready before the beginning of epoch T+1. We make sure this happens by making the node start downloading the state for shard 1 at the beginning of epoch T and applying blocks during epoch T to shard 1's state. Because downloading state can take time, the node may have already processed some blocks (for shard 0 at this epoch), so when the state finishes downloading, the node needs to "catch up" processing these blocks for shard 1.
With dynamic resharding, shard assignments change across epochs, making catchup a regular part of normal operation.
Image below: Example of the node, that tracked only shard 0 in epoch T-1, and will start tracking shard 0 & 1 in epoch T+1.
At the beginning of the epoch T, it will initiate the state download (green) and afterwards will try to 'catchup' the blocks (orange). After blocks are caught up, it will continue processing as normal.

How catchup interacts with normal block processing
The catchup process has two phases: downloading states for shards that we are going to care about in epoch T+1 and catching up blocks that have already been applied.
When epoch T starts, the node will start downloading states of shards that it
will track for epoch T+1, which it doesn't track already. Downloading happens in
a different thread so ClientActor can still process new blocks. Before the
shard states for epoch T+1 are ready, processing new blocks only applies chunks
for the shards that the node is tracking in epoch T. When the shard states for
epoch T+1 finish downloading, the catchup process needs to reprocess the
blocks that have already been processed in epoch T to apply the chunks for the
shards in epoch T+1. We assume that it will be faster than regular block
processing, because blocks are not full and block production has its own delays,
so catchup can finish within an epoch.
In other words, there are three modes for applying chunks and two code paths,
either through the normal process_block (blue) or through catchup_blocks
(orange). When process_block, either that the shard states for the next epoch
are ready, corresponding to IsCaughtUp and all shards the node is tracking in
this, or will be tracking in the next, epoch will be applied, or when the
states are not ready, corresponding to NotCaughtUp, then only the shards for
this epoch will be applied. When catchup_blocks, shards for the next epoch
will be applied.
#![allow(unused)] fn main() { enum ApplyChunksMode { IsCaughtUp, CatchingUp, NotCaughtUp, } }
How catchup works
The catchup process is initiated by process_block, where we check if the block
is caught up and if we need to download states. The logic works as follows:
- For the first block in an epoch T, we check if the previous block is caught up, which signifies if the state of the new epoch is ready. If the previous block is not caught up, the block will be orphaned and not processed for now because it is not ready to be processed yet. Ideally, this case should never happen, because the node will appear stalled until the blocks in the previous epoch are catching up.
- Otherwise, we start processing blocks for the new epoch T. For the first
block, we always mark it as not caught up and will initiate the process
for downloading states for shards that we are going to care about in epoch
T+1. Info about downloading states is persisted in
DBCol::StateDlInfos. - For other blocks, we mark them as not caught up if the previous block is not
caught up. This info is persisted in
DBCol::BlocksToCatchupwhich stores mapping from previous block to vector of all child blocks to catch up. - Chunks for already tracked shards will be applied during
process_block, as we said before mentioningApplyChunksMode. - Once we downloaded state, we start catchup. It will take blocks from
DBCol::BlocksToCatchupin breadth-first search order and apply chunks for shards which have to be tracked in the next epoch. - When catchup doesn't see any more blocks to process,
DBCol::BlocksToCatchupis cleared, which means that catchup process is finished.
The catchup process is implemented through the function Client::run_catchup.
ClientActor schedules a call to run_catchup every 100ms. However, the call
can be delayed if ClientActor has a lot of messages in its actor queue.
Every time run_catchup is called, it checks DBCol::StateDlInfos to see
if there are any shard states that should be downloaded. If so, it
initiates the syncing process for these shards. After the state is downloaded,
run_catchup will start to apply blocks that need to be caught up.
One thing to note is that run_catchup is located at ClientActor, but
intensive work such as applying state parts and applying blocks is actually
offloaded to SyncJobsActor in another thread, because we don't want
ClientActor to be blocked by this. run_catchup is simply responsible for
scheduling SyncJobsActor to do the intensive job. Note that SyncJobsActor is
state-less, it doesn't have write access to the chain. It will return the changes
that need to be made as part of the response to ClientActor, and ClientActor
is responsible for applying these changes. This is to ensure only one thread
(ClientActor) has write access to the chain state. However, this also adds a
lot of limits, for example, SyncJobsActor can only be scheduled to apply one
block at a time. Because run_catchup is only scheduled to run every 100ms, the
speed of catching up blocks is limited to 100ms per block, even when blocks
applying can be faster. Similar constraints happen to apply state parts.
Improvements
There are three improvements we can make to the current code.
First, currently we always initiate the state downloading process at the first block of an epoch, even when there are no new states to be downloaded for the new epoch. This is unnecessary.
Second, even though run_catchup is scheduled to run every 100ms, the call can
be delayed if ClientActor has messages in its actor queue. A better way to do
this is to move the scheduling of run_catchup to check_triggers.
Third, because of how run_catchup interacts with SyncJobsActor, run_catchup
can catch up at most one block every 100 ms. This is because we don't want to
write to ChainStore in multiple threads. However, the changes that catching up
blocks make do not interfere with regular block processing and they can be
processed at the same time. However, to restructure this, we will need to
re-implement ChainStore to separate the parts that can be shared among threads
and the part that can't.
Garbage Collection
This document covers the basics of Chain garbage collection.
Currently we run garbage collection only in non-archival nodes, to keep the size of the storage under control. Therefore, we remove blocks, chunks and state that is ‘old’ enough - which in current configuration means 5 epochs ago.
We run a single ‘round’ of GC after a new block is accepted to the chain - and in order not to delay the chain too much, we make sure that each round removes at most 2 blocks from the chain.
For more details look at function clear_data() in file chain/chain/src/garbage_collection.rs
How it works
Imagine the following chain (with 2 forks)

In the pictures below, let’s assume that epoch length is 5 and we keep only 3 epochs (rather than 5 that is currently set in production) - otherwise the image becomes too large 😉.
If head is in the middle of the epoch, the gc_stop will be set to the first
block of epoch T-2, and tail & fork_tail will be sitting at the last block of
epoch T-3.
(and no GC is happening in this round - as tail is next to gc_stop).

Next block was accepted on the chain (head jumped ahead), but still no GC happening in this round:

Now interesting things will start happening once head ‘crosses’ over to the next epoch.
First, the gc_stop will jump to the beginning of the next epoch.

Then we’ll start the GC of the forks: by first moving the fork_tail to match
the gc_stop and going backwards from there.

It will start removing all the blocks that don’t have a successor (a.k.a the tip of the fork). And then it will proceed to lower height.

Will keep going until it ‘hits’ the tail.

In order not to do too much in one go, we’d only remove up to 2 block in each run (that happens after each head update).
Now, the forks are gone, so we can proceed with GCing of the blocks from the canonical chain:

Same as before, we’d remove up to 2 blocks in each run:

Until we catch up to the gc_stop.
Block header garbage collection
Before epoch sync existed, nodes needed all block headers to sync to the latest chain, so headers were kept forever. Now that epoch sync provides a lightweight proof-based bootstrap mechanism, old block headers are no longer needed and are garbage collected alongside their corresponding blocks.
When GC processes a block (in clear_block_data()), it also deletes the block
header from DBCol::BlockHeader. Sufficient headers are always kept for
transaction validation: transaction_validity_period requires headers for
approximately the last two epochs, and GC retains at least
MIN_GC_NUM_EPOCHS_TO_KEEP = 3 epochs of data.
On archival nodes with split storage, block headers are copied to cold storage before being removed from the hot store.
How Epoch Works
This short document will tell you all you need to know about Epochs in NEAR protocol.
You can also find additional information about epochs in nomicon.
What is an Epoch?
Epoch is a sequence of consecutive blocks. Within one epoch, the set of validators is fixed, and validator rotation happens at epoch boundaries.
Basically almost all the changes that we do are happening at epoch boundaries:
- sharding changes
- protocol version changes
- validator changes
- changing tracking shards
- state sync
Where does the Epoch Id come from?
EpochId for epoch T+2 is the last hash of the block of epoch T.

Situation at genesis is interesting. We have three blocks:
dummy ← genesis ← first-block
Where do we set the epoch length?
Epoch length is set in the genesis config. Currently in mainnet it is set to 43200 blocks:
"epoch_length": 43200
See the mainnet genesis for more details.
This means that each epoch lasts around 15 hours.
Important: sometimes there might be ‘troubles’ on the network, that might result in epoch lasting a little bit longer (if we cannot get enough signatures on the last blocks of the previous epoch).
You can read specific details on our nomicon page.
How do we pick the next validators?
TL;DR: in the last block of the epoch T, we look at the accounts that have highest stake and we pick them to become validators in T+2.
We are deciding on validators for T+2 (and not T+1) as we want to make sure that validators have enough time to prepare for block production and validation (they have to download the state of shards etc).
For more info on how we pick validators please look at nomicon.
Epoch and Sharding
Sharding changes happen only on epoch boundary - that’s why many of the requests
(like which shard does my account belong to), require also an epoch_id as a
parameter.
As of April 2022 we don’t have dynamic sharding yet, so the whole chain is simply using 4 shards.
How can I get more information about current/previous epochs?
We don’t show much information about Epochs in Explorer. Today, you can use
state_viewer (if you have access to the network database).
At the same time, we’re working on a small debug dashboard, to show you the basic information about past epochs - stay tuned.
Technical details
Where do we store epoch info?
We use a couple of columns in the database to store epoch information:
- ColEpochInfo = 11 - is storing the mapping from EpochId to EpochInfo structure that contains all the details.
- ColEpochStart = 23 - has a mapping from EpochId to the first block height of that epoch.
- ColEpochValidatorInfo = 47 - contains validator statistics (blocks produced etc.) for each epoch.
How does epoch info look like?
Here’s the example epoch info from a localnet node. As you can see below, EpochInfo mostly contains information about who is the validator and in which order should they produce the blocks.
EpochInfo.V3(
epoch_height=7,
validators=ListContainer([
validator_stake.V1(account_id='node0', public_key=public_key.ED25519(tuple_data=ListContainer([b'7PGseFbWxvYVgZ89K1uTJKYoKetWs7BJtbyXDzfbAcqX'])), stake=51084320187874404740382878961615),
validator_stake.V1(account_id='node2', public_key=public_key.ED25519(tuple_data=ListContainer([b'GkDv7nSMS3xcqA45cpMvFmfV1o4fRF6zYo1JRR6mNqg5'])), stake=51084320187874404740382878961615),
validator_stake.V1(account_id='node1', public_key=public_key.ED25519(tuple_data=ListContainer([b'6DSjZ8mvsRZDvFqFxo8tCKePG96omXW7eVYVSySmDk8e'])), stake=50569171534262067815663761517574)]),
validator_to_index={'node0': 0, 'node1': 2, 'node2': 1},
block_producers_settlement=ListContainer([0, 1, 2]),
chunk_producers_settlement=ListContainer([ListContainer([0, 1, 2]), ListContainer([0, 1, 2]), ListContainer([0, 1, 2]), ListContainer([0, 1, 2]), ListContainer([0, 1, 2])]),
hidden_validators_settlement=ListContainer([]),
fishermen=ListContainer([]),
fishermen_to_index={},
stake_change={'node0': 51084320187874404740382878961615, 'node1': 50569171534262067815663761517574, 'node2': 51084320187874404740382878961615},
validator_reward={'near': 37059603312899067633082436, 'node0': 111553789870214657675206177, 'node1': 110428850075662293347329569, 'node2': 111553789870214657675206177},
validator_kickout={},
minted_amount=370596033128990676330824359,
seat_price=24438049905601740367428723111,
protocol_version=52
)
Transaction Routing
We all know that transactions are ‘added’ to the chain - but how do they get there?
Hopefully by the end of this article, the image below should make total sense.

Step 1: Transaction creator/author
The journey starts with the author of the transaction - who creates the transaction object (basically list of commands) - and signs them with their private key.
Basically, they prepare the payload that looks like this:
#![allow(unused)] fn main() { pub struct SignedTransaction { pub transaction: Transaction, pub signature: Signature, } }
With such a payload, they can go ahead and send it as a JSON-RPC request to ANY node in the system (they can choose between using ‘sync’ or ‘async’ options).
From now on, they’ll also be able to query the status of the transaction - by using the hash of this object.
Fun fact: the Transaction object also contains some fields to prevent
attacks: like nonce to prevent replay attack, and block_hash to limit the
validity of the transaction (it must be added within
transaction_validity_period (defined in genesis) blocks of block_hash).
Step 2: Inside the node
Our transaction has made it to a node in the system - but most of the nodes are not validators - which means that they cannot mutate the chain.
That’s why the node has to forward it to someone who can - the upcoming validator.
The node, roughly, does the following steps:
- verify transaction’s metadata - check signatures etc. (we want to make sure that we don’t forward bogus data)
- forward it to the ‘upcoming’ validator - currently we pick the validators that
would be a chunk creator in +2, +3, +4 and +8 blocks (this is controlled by
TX_ROUTING_HEIGHT_HORIZON) - and send the transaction to all of them.
Step 3: En-route to validator/producer
Great, the node knows to send (forward) the transaction to the validator, but how does the routing work? How do we know which peer is hosting a validator?
Each validator is regularly (every config.ttl_account_id_router/2 seconds == 30
minutes in production) broadcasting so called AnnounceAccount, which is
basically a pair of (account_id, peer_id), to the whole network. This way each
node knows which peer_id to send the message to.
Then it asks the routing table about the shortest path to the peer, and sends
the ForwardTx message to the peer.
Step 4: Chunk producer
When a validator receives such a forwarded transaction, it double-checks that it is
about to produce the block, and if so, it adds the transaction to the mempool
(TransactionPool) for this shard, where it waits to be picked up when the chunk
is produced.
What happens afterwards will be covered in future episodes/articles.
Additional notes
Transaction being added multiple times
But such an approach means, that we’re forwarding the same transaction to multiple validators (currently 4) - so can it be added multiple times?
No. Remember that a transaction has a concrete hash which is used as a global identifier. If the validator sees that the transaction is present in the chain, it removes it from its local mempool.
Can transaction get lost?
Yes - they can and they do. Sometimes a node doesn’t have a path to a given
validator or it didn’t receive an AnnounceAccount for it, so it doesn’t know
where to forward the message. And if this happens to all 4 validators that we
try to send to, then the message can be silently dropped.
We’re working on adding some monitoring to see how often this happens.
Transactions, Receipts and Chunk Surprises
We finished the previous article (Transaction routing) where a transaction was successfully added to the soon-to-be block producer’s mempool.
In this article, we’ll cover what happens next: How it is changed into a receipt and executed, potentially creating even more receipts in the process.
First, let’s look at the ‘high-level view’:

Transaction vs Receipt
As you can see from the image above:
Transactions are ‘external’ communication - they are coming from the outside.
Receipts are used for ‘internal’ communication (cross shard, cross contract) - they are created by the block/chunk producers.
Life of a Transaction
If we ‘zoom-in‘, the chunk producer's work looks like this:

Step 1: Process Transaction into receipt
Once a chunk producer is ready to produce a chunk, it will fetch the transactions from its mempool, check that they are valid, and if so, prepare to process them into receipts.
Note: There are additional restrictions (e.g. making sure that we take them in the right order, that we don’t take too many, etc.) - that you can see in nomicon’s transaction page.
You can see this part in explorer:

Step 2: Sending receipt to the proper destination
Once we have a receipt, we have to send it to the proper destination - by adding
it to the outgoing_receipt list, which will be forwarded to the chunk
producers from the next block.
Note: There is a special case here - if the sender of the receipt is the
same as the receiver, then the receipt will be added to the local_receipts
queue and executed in the same block.
Step 3: When an incoming receipt arrives
(Note: this happens in the ‘next’ block)
When a chunk producer receives an incoming receipt, it will try to execute its actions (creating accounts, executing function calls etc).
Such actions might generate additional receipts (for example a contract might want to call other contracts). All these outputs are added to the outgoing receipt queue to be executed in the next block.
If the incoming receipt queue is too large to execute in the current chunk, the producer will put the remaining receipts onto the ‘delayed’ queue.
Step 4: Profit
When all the ‘dependant’ receipts are executed for a given transaction, we can consider the transaction to be successful.
[Advanced] But reality is more complex
Caution: In the section below, some things are simplified and do not match exactly how the current code works.
Let’s quickly also check what’s inside a Chunk:
#![allow(unused)] fn main() { pub struct ShardChunkV2 { pub chunk_hash: ChunkHash, pub header: ShardChunkHeader, pub transactions: Vec<SignedTransaction>, pub receipts: Vec<Receipt>, // outgoing receipts from 'previous' block } }
Yes, it is a little bit confusing, that receipts here are NOT the ‘incoming’ ones for this chunk, but instead the ‘outgoing’ ones from the previous block, i.e. all receipts from shard 0, block B are actually found in shard 0, block B+1. Why?!?!
This has to do with performance.
The steps usually followed for producing a block are as follows
- Chunk producer executes the receipts and creates a chunk. It sends the chunk to other validators. Note that it's the execution/processing of the receipts that usually takes the most time.
- Validators receive the chunk and validate it before signing the chunk. Validation involves executing/processing of the receipts in the chunk.
- Once the next block chunk producer receives the validation (signature), only then can it start producing the next chunk.
Simple approach
First, let’s imagine how the system would look like, if chunks contained things that we’d expect:
- list of transactions
- list of incoming receipts
- list of outgoing receipts
- hash of the final state
This means, that the chunk producer has to compute all this information first, before sending the chunk to other validators.

Once the other validators receive the chunk, they can start their own processing to verify those outgoing receipts/final state - and then do the signing. Only then, can the next chunk producer start creating the next chunk.
While this approach does work, we can do it faster.
Faster approach
What if the chunk didn’t contain the ‘output’ state? This changes our ‘mental’ model a little bit, as now when we’re singing the chunk, we’d actually be verifying the previous chunk - but that’s the topic for the next article (to be added).
For now, imagine if the chunk only had:
- a list of transactions
- a list of incoming receipts
In this case, the chunk producer could send the chunk a lot earlier, and validators (and chunk producer) could do their processing at the same time:

Now the last mystery: Why do we have ‘outgoing’ receipts from previous chunks rather than incoming to the current one?
This is yet another optimization. This way the chunk producer can send out the chunk a little bit earlier - without having to wait for all the other shards.
But that’s a topic for another article (to be added).
Cross shard transactions - deep dive
In this article, we'll look deeper into how cross-shard transactions are working
on the simple example of user shard0 transferring money to user shard1.
These users are on separate shards (shard0 is on shard 0 and shard1 is on
shard 1).
Imagine, we run the following command in the command line:
NEAR_ENV=local near send shard0 shard1 500
What happens under the hood? How is this transaction changed into receipts and processed by near?
From Explorer perspective
If you look at a simple token transfer in explorer (example), you can see that it is broken into three separate sections:
- convert transaction into receipt ( executed in block B )
- receipt that transfers tokens ( executed in block B+1 )
- receipt that refunds gas ( executed in block B+2 )
But under the hood, the situation is a little bit more complex, as there is actually one more receipt (that is created after converting the transaction). Let's take a deeper look.
Internal perspective (Transactions & Receipts)
One important thing to remember is that NEAR is sharded - so in all our designs, we have to assume that each account is on a separate shard. So that the fact that some of them are colocated doesn't give any advantage.
Step 1 - Transaction
This is the part which we receive from the user (SignedTransaction) - it has 3
parts:
- signer (account + key) who signed the transaction
- receiver (in which account context should we execute this)
- payload - a.k.a Actions to execute.
As the first step, we want to change this transaction into a Receipt (a.k.a 'internal' message) - but before doing that, we must verify that:
- the message signature matches (that is - that this message was actually signed by this key)
- that this key is authorized to act on behalf of that account (so it is a full access key to this account - or a valid function key).
The last point above means, that we MUST execute this (Transaction to Receipt)
transition within the shard that the signer belongs to (as other shards don't
know the state that belongs to signer - so they don't know which keys it has).
So actually if we look inside the chunk 0 (where shard0 belongs) at block
B, we'll see the transaction:
Chunk: Ok(
V2(
ShardChunkV2 {
chunk_hash: ChunkHash(
8mgtzxNxPeEKfvDcNdFisVq8TdeqpCcwfPMVk219zRfV,
),
header: V3(
ShardChunkHeaderV3 {
inner: V2(
ShardChunkHeaderInnerV2 {
prev_block_hash: CgTJ7FFwmawjffrMNsJ5XhvoxRtQPXdrtAjrQjG91gkQ,
prev_state_root: 99pXnYjQbKE7bEf277urcxzG3TaN79t2NgFJXU5NQVHv,
outcome_root: 11111111111111111111111111111111,
encoded_merkle_root: 67zdyWTvN7kB61EgTqecaNgU5MzJaCiRnstynerRbmct,
encoded_length: 187,
height_created: 1676,
shard_id: 0,
gas_used: 0,
gas_limit: 1000000000000000,
balance_burnt: 0,
outgoing_receipts_root: 8s41rye686T2ronWmFE38ji19vgeb6uPxjYMPt8y8pSV,
tx_root: HyS6YfQbfBRniVSbWRnxsxEZi9FtLqHwyzNivrF6aNAM,
validator_proposals: [],
},
),
height_included: 0,
signature: ed25519:uUvmvDV2cRVf1XW93wxDU8zkYqeKRmjpat4UUrHesJ81mmr27X43gFvFuoiJHWXz47czgX68eyBN38ejwL1qQTD,
hash: ChunkHash(
8mgtzxNxPeEKfvDcNdFisVq8TdeqpCcwfPMVk219zRfV,
),
},
),
transactions: [
SignedTransaction {
transaction: Transaction {
signer_id: AccountId(
"shard0",
),
public_key: ed25519:Ht8EqXGUnY8B8x7YvARE1LRMEpragRinqA6wy5xSyfj5,
nonce: 11,
receiver_id: AccountId(
"shard1",
),
block_hash: 6d5L1Vru2c4Cwzmbskm23WoUP4PKFxBHSP9AKNHbfwps,
actions: [
Transfer(
TransferAction {
deposit: 500000000000000000000000000,
},
),
],
},
signature: ed25519:63ssFeMyS2N1khzNFyDqiwSELFaUqMFtAkRwwwUgrPbd1DU5tYKxz9YL2sg1NiSjaA71aG8xSB7aLy5VdwgpvfjR,
hash: 6NSJFsTTEQB4EKNKoCmvB1nLuQy4wgSKD51rfXhmgjLm,
size: 114,
},
],
receipts: [],
},
),
)
Side note: When we're converting the transaction into a receipt, we also use this moment to deduct prepaid gas fees and transferred tokens from the 'signer' account. The details on how much gas is charged can be found at https://nomicon.io/RuntimeSpec/Fees/.
Step 2 - cross shard receipt
After transaction was changed into a receipt, this receipt must now be sent to
the shard where the receiver is (in our example shard1 is on shard 1).
We can actually see this in the chunk of the next block:
Chunk: Ok(
V2(
ShardChunkV2 {
chunk_hash: ChunkHash(
DoF7yoCzyBSNzB8R7anWwx6vrimYqz9ZbEmok4eqHZ3m,
),
header: V3(
ShardChunkHeaderV3 {
inner: V2(
ShardChunkHeaderInnerV2 {
prev_block_hash: 82dKeRnE262qeVf31DXaxHvbYEugPUDvjGGiPkjm9Rbp,
prev_state_root: DpsigPFeVJDenQWVueGKyTLVYkQuQjeQ6e7bzNSC7JVN,
outcome_root: H34BZknAfWrPCcppcHSqbXwFvAiD9gknG8Vnrzhcc4w,
encoded_merkle_root: 3NDvQBrcRSAsWVPWkUTTrBomwdwEpHhJ9ofEGGaWsBv9,
encoded_length: 149,
height_created: 1677,
shard_id: 0,
gas_used: 223182562500,
gas_limit: 1000000000000000,
balance_burnt: 22318256250000000000,
outgoing_receipts_root: Co1UNMcKnuhXaHZz8ozMnSfgBKPqyTKLoC2oBtoSeKAy,
tx_root: 11111111111111111111111111111111,
validator_proposals: [],
},
),
height_included: 0,
signature: ed25519:32hozA7GMqNqJzscEWzYBXsTrJ9RDhW5Ly4sp7FXP1bmxoCsma8Usxry3cjvSuywzMYSD8HvGntVtJh34G2dKJpE,
hash: ChunkHash(
DoF7yoCzyBSNzB8R7anWwx6vrimYqz9ZbEmok4eqHZ3m,
),
},
),
transactions: [],
receipts: [
Receipt {
predecessor_id: AccountId(
"shard0",
),
receiver_id: AccountId(
"shard1",
),
receipt_id: 3EtEcg7QSc2CYzuv67i9xyZTyxBD3Dvx6X5yf2QgH83g,
receipt: Action(
ActionReceipt {
signer_id: AccountId(
"shard0",
),
signer_public_key: ed25519:Ht8EqXGUnY8B8x7YvARE1LRMEpragRinqA6wy5xSyfj5,
gas_price: 103000000,
output_data_receivers: [],
input_data_ids: [],
actions: [
Transfer(
TransferAction {
deposit: 500000000000000000000000000,
},
),
],
},
),
},
],
},
),
)
Side comment: notice that the receipt itself no longer has a signer field, but
a predecessor_id one.
Such a receipt is sent to the destination shard (we'll explain this process in a separate article) where it can be executed.
3. Gas refund
When shard 1 processes the receipt above, it is then ready to refund the unused
gas to the original account (shard0). So it also creates the receipt, and puts
it inside the chunk. This time it is in shard 1 (as that's where it was
executed).
Chunk: Ok(
V2(
ShardChunkV2 {
chunk_hash: ChunkHash(
8sPHYmBFp7cfnXDAKdcATFYfh9UqjpAyqJSBKAngQQxL,
),
header: V3(
ShardChunkHeaderV3 {
inner: V2(
ShardChunkHeaderInnerV2 {
prev_block_hash: Fj7iu26Yy9t5e9k9n1fSSjh6ZoTafWyxcL2TgHHHskjd,
prev_state_root: 4y6VL9BoMJg92Z9a83iqKSfVUDGyaMaVU1RNvcBmvs8V,
outcome_root: 7V3xRUeWgQa7D9c8s5jTq4dwdRcyTuY4BENRmbWaHiS5,
encoded_merkle_root: BnCE9LZgnFEjhQv1fSYpxPNw56vpcLQW8zxNmoMS8H4u,
encoded_length: 149,
height_created: 1678,
shard_id: 1,
gas_used: 223182562500,
gas_limit: 1000000000000000,
balance_burnt: 22318256250000000000,
outgoing_receipts_root: HYjZzyTL5JBfe1Ar4C4qPKc5E6Vbo9xnLHBKLVAqsqG2,
tx_root: 11111111111111111111111111111111,
validator_proposals: [],
},
),
height_included: 0,
signature: ed25519:4FzcDw2ay2gAGosNpFdTyEwABJhhCwsi9g47uffi77N21EqEaamCg9p2tALbDt5fNeCXXoKxjWbHsZ1YezT2cL94,
hash: ChunkHash(
8sPHYmBFp7cfnXDAKdcATFYfh9UqjpAyqJSBKAngQQxL,
),
},
),
transactions: [],
receipts: [
Receipt {
predecessor_id: AccountId(
"system",
),
receiver_id: AccountId(
"shard0",
),
receipt_id: 6eei79WLYHGfv5RTaee4kCmzFx79fKsX71vzeMjCe6rL,
receipt: Action(
ActionReceipt {
signer_id: AccountId(
"shard0",
),
signer_public_key: ed25519:Ht8EqXGUnY8B8x7YvARE1LRMEpragRinqA6wy5xSyfj5,
gas_price: 0,
output_data_receivers: [],
input_data_ids: [],
actions: [
Transfer(
TransferAction {
deposit: 669547687500000000,
},
),
],
},
),
},
],
},
),
)
Such gas refund receipts are a little bit special - as we'll set the
predecessor_id to be system - but the receiver is what we expect (shard0
account).
Note: system is a special account that doesn't really belong to any shard.
As you can see in this example, the receipt was created within shard 1.
So putting it all together would look like this:

But wait - NEAR was saying that transfers are happening with 2 blocks - but here I see that it took 3 blocks. What's wrong?
The image above is a simplification, and reality is a little bit trickier - especially as receipts in a given chunks are actually receipts received as a result from running a PREVIOUS chunk from this shard.
We'll explain it more in the next section.
Advanced: What's actually going on?
As you could have read in Transactions And Receipts - the 'receipts' field in the chunk is actually representing 'outgoing' receipts from the previous block.
So our image should look more like this:

In this example, the black boxes are representing the 'processing' of the chunk, and red arrows are cross-shard communication.
So when we process Shard 0 from block 1676, we read the transaction, and output the receipt - which later becomes the input for shard 1 in block 1677.
But you might still be wondering - so why didn't we add the Receipt (transfer) to the list of receipts of shard0 1676?
That's because the shards & blocks are set BEFORE we do any computation. So the more correct image would look like this:

Here you can clearly see that chunk processing (black box), is happening AFTER the chunk is set.
In this example, the blue arrows are showing the part where we persist the result (receipt) into next block's chunk.
In a future article, we'll discuss how the actual cross-shard communication works (red arrows) in the picture, and how we could guarantee that a given shard really gets all the red arrows, before it starts processing.
Gas
This page describes the technical details around gas during the lifecycle of a transaction(*) while giving an intuition for why things are the way they are from a technical perspective. For a more practical, user-oriented angle, please refer to the gas section in the official protocol documentation.
(*) For this page, a transaction shall refer to the set of all recursively
generated receipts by a SignedTransaction. When referring to only the original
transaction object, we write SignedTransaction.
The topic is split into several sections.
- Gas Flow
- Buying Gas: How are NEAR tokens converted to gas?
- Burning Gas: Who receives burnt tokens?
- Gas in Contract Calls: How is gas attached to calls?
- Contract Reward: How smart contract earn a reward.
- Gas Price:
- Block-Level Gas Price: How the block-level gas price is determined.
- Pessimistic Gas Price: How worst-case gas pricing is estimated.
- Gas Refund Fee: The cost paid for a gas refund receipt.
- Tracking Gas: How the system keeps track of purchased gas during the transaction execution.
Gas Flow
On the highest level, gas is bought by the signer, burnt during execution, and contracts receive a part of the burnt gas as a reward. We will discuss each step in more details.
Buying Gas for a Transaction
A signer pays all the gas required for a transaction upfront. However, there is
no explicit act of buying gas. Instead, the fee is subtracted directly in NEAR
tokens from the balance of the signer's account. The fee is calculated as gas amount * gas price. The gas amount for actions included in a SignedTransaction
are all fixed, except for function calls where the user needs to specify the attached
gas amount for the dynamic execution part.
(See here for more details.)
If the account has insufficient balance to pay for this, it will fail with a
NotEnoughBalance error, with the required balance included in the error message.
The gas amount is not a field of SignedTransaction, nor is it something the
signer can choose. It is only a virtual field that is computed on-chain following
the protocol's rules.
The gas price is a variable that may change during the execution of the
transaction. The way it is implemented today, a single transaction can be
charged a different gas price for different receipts.
Already we can see a fundamental problem: Gas is bought once at the beginning but the gas price may change during execution. To solve this incompatibility, the protocol used to calculate a pessimistic gas price for the initial purchase. Later on, the delta between real and pessimistic gas prices would be refunded at the end of every receipt execution.
Generating a refund receipts for every executed function call has become a non-trivial overhead, limiting total throughput. Therefore, with the adoption of NEP-536 the model was changed.
With version 78 and onward, the protocol simply ignores gas price changes between time of purchase and time of use. A transaction buys gas at one price and burns it at the same price. While this avoids the need for refunds due to price changes, it also means that transactions with deep receipt calls can end up with a cheaper gas price competing for the same chunk space. The community took note of this trade-off and agreed to take it.
Burning Gas
Buying gas immediately removes a part of the signer's tokens from the total supply. However, the equivalent value in gas still exists in the form of the receipt and the unused gas will be converted back to tokens as a refund after subtracting a small gas refund fee. (More on the fee further down.)
The gas spent on execution on the other hand is burnt and removed from total supply forever. Unlike gas in other chains, none of it goes to validators. This is roughly equivalent to the base fee burning mechanism which Ethereum added in EIP-1559. But in Near Protocol, the entire fee is burnt, whereas in Ethereum the priority fee goes to validators.
The following diagram shows how gas flows through the execution of a transaction. The transaction consists of a function call performing a cross contract call, hence two function calls in sequence. (Note: This diagram is slightly simplified, more accurate diagrams are further down.)
Gas in Contract Calls
A function call has a fixed gas cost to be initiated. Then the execution itself
draws gas from the attached_gas, sometimes also called prepaid_gas, until it
reaches zero, at which point the function call aborts with a GasExceeded
error. No changes are persisted on chain.
(Note on naming: If you see prepaid_fee: Balance in the nearcore code base,
this is NOT only the fee for prepaid_gas. It also includes prepaid fees for
other gas costs. However, prepaid_gas: Gas is used the same in the code base
as described in this document.)
Attaching gas to function calls is the primary way for end-users and contract developers to interact with gas. All other gas fees are implicitly computed and are hidden from the users except for the fact that the equivalent in tokens is removed from their account balance.
To attach gas, the signer sets the gas field of the function call action.
Wallets and CLI tools expose this to the users in different ways. Usually just
as a gas field, which makes users believe this is the maximum gas the
transaction will consume. Which is not true, the maximum is the specified number
plus the fixed base cost.
Contract developers also have to pick the attached gas values when their
contract calls another contract. They cannot buy additional gas, they have to
work with the unspent gas attached to the current call. They can check how much
gas is left by subtracting the used_gas() from the prepaid_gas() host
function results. But they cannot use all the available gas, since that would
prevent the current function call from executing to the end.
The gas attached to a function can be at most max_total_prepaid_gas, which is
300 Tgas since the mainnet launch. Note that this limit is per
SignedTransaction, not per function call. In other words, batched function
calls share this limit.
There is also a limit to how much single call can burn, max_gas_burnt, which
used to be 200 Tgas but has been increased to 300 Tgas in protocol version 52.
(Note: When attaching gas to an outgoing function call, this is not counted as
gas burnt.) However, given a call can never burn more than was attached anyway,
this second limit is obsolete with the current configuration where the two limits
are equal.
Since protocol version 53, with the stabilization of
NEP-264, contract
developers do not have to specify the absolute amount of gas to attach to calls.
promise_batch_action_function_call_weight allows to specify a ratio of unspent
gas that is computed after the current call has finished. This allows attaching
100% of unspent gas to a call. If there are multiple calls, this allows
attaching an equal fraction to each, or any other split as defined by the weight
per call.
Contract Reward
A rather unique property of Near Protocol is that a part of the gas fee goes to the contract owner. This "smart contract gets paid" model is pretty much the opposite design choice from the "smart contract pays" model that for example Cycles in the Internet Computer implement.
The idea is that it gives contract developers a source of income and hence an incentive to create useful contracts that are commonly used. But there are also downsides, such as when implementing a free meta-transaction relayer one has to be careful not to be susceptible to faucet-draining attacks where an attacker extracts funds from the relayer by making calls to a contract they own.
How much contracts receive from execution depends on two things.
- How much gas is burnt on the function call execution itself. That is, only
the gas taken from the
attached_gasof a function call is considered for contract rewards. The base fees paid for creating the receipt, including theaction_function_callfee, are burnt 100%. - The remainder of the burnt gas is multiplied by the runtime configuration
parameter
burnt_gas_rewardwhich currently is at 30%.
During receipt execution, nearcore code tracks the gas_burnt_for_function_call
separately from other gas burning to enable this contract reward calculations.
In the (still slightly simplified) flow diagram, the contract reward looks like this.
For brevity, gas_burnt_for_function_call in the diagram is denoted as wasm fee.
Gas Price
Gas pricing is a surprisingly deep and complicated topic. Usually, we only think
about the value of the gas_price field in the block header. However, to
understand the internals, this is not enough.
Block-Level Gas Price
gas_price is a field in the block header. It determines how much it costs to
buy gas at the given block height.
The price is measured in NEAR tokens per unit of gas. It dynamically changes in the range between 0.1 NEAR per Pgas and 2 NEAR per Pgas, based on demand. (1 Pgas = 1000 Tgas corresponds to a full chunk.)
The block producer has to set this field following the exact formula as defined by the protocol. Otherwise, the produced block is invalid.
Intuitively, the formula checks how much gas was used compared to the total capacity. If it exceeds 50%, the gas price increases exponentially within the limits. When the demand is below 50%, it decreases exponentially. In practice, it stays at the bottom most of the time.
Note that all shards share the same gas price. Hence, if one out of four shards is at 100% capacity, this will not cause the price to increase. The 50% capacity is calculated as an average across all shards.
Going slightly off-topic, it should also be mentioned that chunk capacity is not
constant. Chunk producers can change it by 0.1% per chunk. The nearcore client
does not currently make use of this option, so it really is a nitpick only
relevant in theory. However, any client implementation such as nearcore must
compute the total capacity as the sum of gas limits stored in the chunk headers
to be compliant. Using a hard-coded 1000 Tgas * num_shards would lead to
incorrect block header validation.
Pessimistic Gas Price
The pessimistic gas price features was removed with protocol version 78 and NEP-536.
Gas Refund Fee
After executing the transaction, there might be unspent gas left. For function calls, this is the normal case, since attaching exactly the right amount of gas is tricky. Additionally, in case of receipt failure, some actions that did not start execution will have the execution gas unspent. This gas is converted back to NEAR tokens and sent as a refund transfer to the original signer.
Before protocol version 78, the full gas amount would be refunded and the refund
transfer action was executed for free. With NEP-536
which was implemented in version 78, the plan was to have the network charge a
fee of 5% of unspent gas or a minimum of 1 Tgas. This often removes the need to
send a refund, which avoids additional load on the network, and it compensates
for the load of the refund receipt when it needs to be issued. This is intended
to discourage users from attaching more gas than needed to their transactions.
In the nearcore code, you will find this fee under the name gas_refund_penalty.
However, due to existing projects that need to attach more gas than they
actually use, the introduction of the new fee has been postponed. The code is
still in place but the parameters were set to 0 in PR
#13579. Among other problems, in
the reference FT implementation, ft_transfer_call requires at least 30 TGas
even if most of the time only a fraction of that is burnt. Once all known
problems are resolved, the plan is to try and introduce the 5% / 1 Tgas parameters.
Technically, even when the parameters are increased again, the refund transfer is still executed for free, since the gas price is set to 0. This keeps it in line with balance refunds. However, when the gas refund is produced, at least 1 Tgas has been burnt on receipt execution, which more than covers for a transfer.
Finally, we can have a complete diagram, including the gas refund penalty.
Receipt Congestion
Near Protocol executes transactions in multiple steps, or receipts. Once a transaction is accepted, the system has committed to finish all those receipts even if it does not know ahead of time how many receipts there will be or on which shards they will execute.
This naturally leads to the problem that if shards just keep accepting more transactions, we might accept workload at a higher rate than we can execute.
Cross-shard congestion as flow problem
For a quick formalized discussion on congestion, let us model the Near Protocol transaction execution as a flow network.
Each shard has a source that accepts new transactions and a sink for burning receipts. The flow is measured in gas. Edges to sinks have a capacity of 1000 Tgas. (Technically, it should be 1300 but let's keep it simple for this discussion.)

The edges between shards are not limited in this model. In reality, we are eventually limited by the receipt sizes and what we can send within a block time through the network links. But if we only look at that limit, we can send very many receipts with a lot of gas attached to them. Thus, the model considers it unlimited.
Okay, we have the capacities of the network modeled. Now let's look at how a receipt execution maps onto it.
Let's say a receipt starts at shard 1 with 300 Tgas. While executing, it burns 100 Tgas and creates an outgoing receipts with 200 Tgas to another shard. We can represent this in the flow network with 100 Tgas to the sink of shard 1 and 200 Tgas to shard 2.

Note: The graph includes the execution of the next block with the 200 Tgas to the sink of shard 2. This should be interpreted as if we continue sending the exact same workload on all shards every block. Then we reach this steady state where we continue to have these gas assignments per edge.
Now we can do some flow analysis. It is immediately obvious that the total outflow per is limited to N * 1000 Tgas but the incoming flow is unlimited.
For a finite amount of time, we can accept more inflow than outflow, we just have to add buffers to store what we cannot execute, yet. But to stay within finite memory requirements, we need to fall back to a flow diagram where outflows are greater or equal to inflows within a finite time frame.
Next, we look at ideas one at a time before combining some of them into the cross-shard congestion design proposed in NEP-539.
Idea 1: Compute the minimum max-flow and stay below that limit
One approach to solve congestion would be to never allow more work into the system than we can execute.
But this is not ideal. Just consider this example where everybody tries to access a contract on the same shard.

In this workload where everyone want to use the capacity of the same shard, the max-flow of the system is essentially the 1000 Tgas that shard 3 can execute. No matter how many additional shards we add, this 1000 Tgas does not increase.
Consequently, if we want to limit inflow to be the same or lower than the
outflow, we cannot accept more than 1000 Tgas / NUM_SHARDS of new transactions
per chunk.

So, can we just put a constant limit on sources that's 1000 Tgas / NUM_SHARDS? Not
really, as this limit is hardly practical. It means we limit global throughput
to that of a single shard. Then why would we do sharding in the first place?
The sad thing is, there is no way around it in the most general case. A congestion control strategy that does not apply this limit to this workload will always have infinitely sized queues.
Of course, we won't give up. We are not limited to a constant capacity limit, we can instead adjust it dynamically. We simply have to find a strategy that detects such workload and eventually applies the required limit.
Most of these strategies can be gamed by malicious actors and probably that
means we eventually fall back to the minimum of 1000 Tgas / NUM_SHARDS. But at
this stage our ambition isn't to have 100% utilization under all malicious
cases. We are instead trying to find a solution that can give 100% utilization
for normal operation and then falls back to 1000 Tgas / NUM_SHARDS when it has
to, in order to prevent out-of-memory crashes.
Idea 2: Limit transactions when we use too much memory
What if we have no limit at the source until we notice we are above the memory threshold we are comfortable with? Then we can reduce the source capacity in steps, potentially down to 0, until buffers are getting emptier and we use less memory again.
If we do that, we can decide between either applying a global limit on all
sources (allow only 1000 Tgas / NUM_SHARDS new transactions on all shards like
in idea 1) or applying the limit only to transactions that go to the shard with
the congestion problem.
The first choice is certainly safe. But it means that a single congested shard leads to all shards slowing down, even if they could keep working faster without ever sending receipts to the congested shard. This is a hit to utilization we want to avoid. So let's try the second way.
In that case we filter transactions by receiver and keep accepting transactions that go to non-congested shards. This would work fine, if all transactions would only have depth 1.
But receipts produced by an accepted transaction can produce more receipts to any other shard. Therefore, we might end up accepting more inflow that indirectly requires bandwidth on the congested shard.

Crucially, when accepting a transaction, we don't know ahead of time which shards will be affected by the full directed graph of receipts in a transaction. We only know the first step. For multi-hop transactions, there is no easy way out.
But it is worth mentioning, that in practice the single-hop function call is the most common case. And this case can be handled nicely by rejecting incoming transactions to congested shards.
Idea 3: Apply backpressure to stop all flows to a congested shard
On top of stopping transactions to congested shards, we can also stop receipts if they have a congested shard as the receiver. We simply put them in a buffer of the sending shard and keep them there until the congested shard has space again for the receipts.

The problem with this idea is that it leads to deadlocks where all receipts in the system are waiting in outgoing buffers but cannot make progress because the receiving shard already has too high memory usage.

Idea 4: Keep minimum incoming queue length to avoid deadlocks
This is the final idea we need. To avoid deadlocks, we ensure that we can always send receipts to a shard that does not have enough work in the delayed receipts queue already.
Basically, the backpressure limits from idea 3 are only applied to incoming receipts but not for the total size. This guarantees that in the congested scenario that previously caused a deadlock, we always have something in the incoming queue to work on, otherwise there wouldn't be backpressure at all.

We decided to measure the incoming congestion level using gas rather than bytes, because it is here to maximize utilization, not to minimize memory consumption. And utilization is best measured in gas. If we have a queue of 10_000 Tgas waiting, even if only 10% of that is burnt in this step of the transaction, we still have 1000 Tgas of useful work we can contribute to the total flow. Thus under the assumption that at least 10% of gas is being burnt, we have 100% utilization.
A limit in bytes would be better to argue how much memory we need exactly. But in some sense, the two are equivalent, as producing large receipts should cost a linear amount of gas. What exactly the conversion rate is, is rather complicated and warrants its own investigation with potential protocol changes to lower the ratio in the most extreme cases. And this is important regardless of how congestion is handled, given that network bandwidth is becoming more and more important as we add more shards. Issue #8214 tracks our effort on estimating what that cost should be and #9378 tracks our best progress on calculating what it is today.
Of course, we can increase the queue to have even better utility guarantees. But it comes at the cost of longer delays for every transaction or receipt that goes through a congested shard.
This strategy also preserves the backpressure property in the sense that all shards on a path from sources to sinks that contribute to congestion will eventually end up with full buffers. Combined with idea 2, eventually all transactions to those shards are rejected. All of this without affecting shards that are not on the critical path.
Putting it all together
The proposal in NEP-539 combines all ideas 2, 3, and 4.
We have a limit of how much memory we consider to be normal operations (for example 500 MB). Then we stop new transaction coming in to that shard but still allow more incoming transactions to other shards if those are not congested. That alone already solves all problems with single-hop transactions.
In the congested shard itself, we also keep accepting transactions to other shards. But we heavily reduce the gas allocated for new transactions, in order to have more capacity to work on finishing the waiting receipts. This is technically not necessary for any specific property, but it should make sense intuitively that this helps to reduce congestion quicker and therefore lead to a better user experience. This is why we added this feature. And our simulations also support this intuition.
Then we apply backpressure for multi-hop receipts and avoid deadlocks by only applying the backpressure when we still have enough work queued up that holding it back cannot lead to a slowed down global throughput.
Another design decision was to linearly interpolate the limits, as opposed to binary on and off states. This way, we don't have to be too precise in finding the right parameters, as the system should balance itself around a specific limit that works for each workload.
Meta Transactions
NEP-366 introduced the concept of meta transactions to Near Protocol. This feature allows users to execute transactions on NEAR without owning any gas or tokens. In order to enable this, users construct and sign transactions off-chain. A third party (the relayer) is used to cover the fees of submitting and executing the transaction.
The MVP for meta transactions is currently in the stabilization process. Naturally, the MVP has some limitations, which are discussed in separate sections below. Future iterations have the potential to make meta transactions more flexible.
Overview
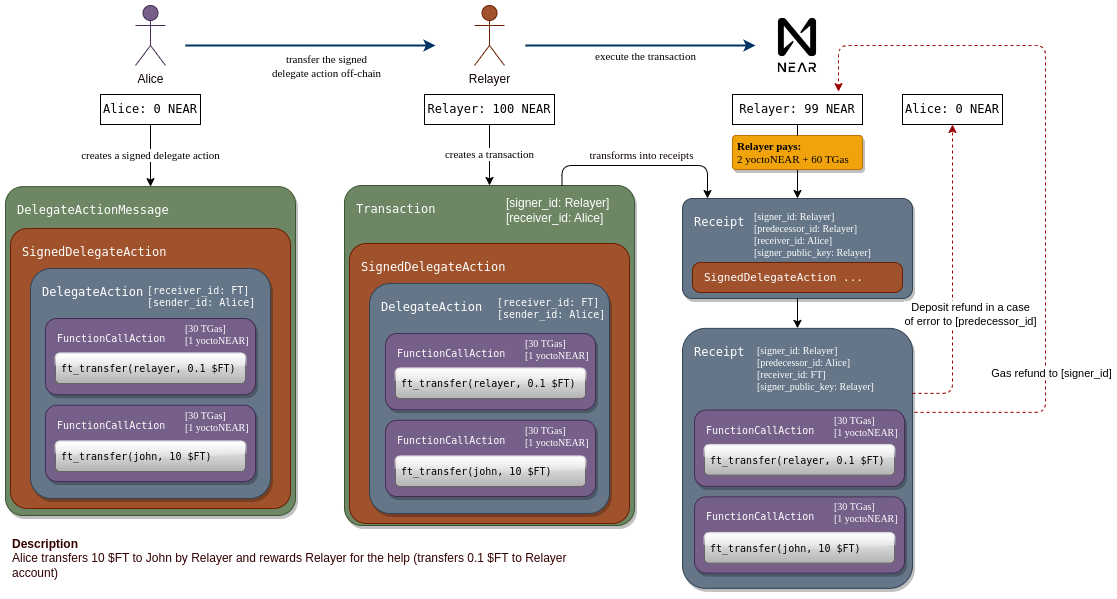 Credits for the diagram go to the NEP authors Alexander Fadeev and Egor
Uleyskiy.
Credits for the diagram go to the NEP authors Alexander Fadeev and Egor
Uleyskiy.
The graphic shows an example use case for meta transactions. Alice owns an
amount of the fungible token $FT. She wants to transfer some to John. To do
that, she needs to call ft_transfer("john", 10) on an account named FT.
In technical terms, ownership of $FT is an entry in the FT contract's storage
that tracks the balance for her account. Note that this is on the application
layer and thus not a part of Near Protocol itself. But FT relies on the
protocol to verify that the ft_transfer call actually comes from Alice. The
contract code checks that predecessor_id is "Alice" and if that is the case
then the call is legitimately from Alice, as only she could create such a
receipt according to the Near Protocol specification.
The problem is, Alice has no NEAR tokens. She only has a NEAR account that
someone else funded for her and she owns the private keys. She could create a
signed transaction that would make the ft_transfer("john", 10) call. But
validator nodes will not accept it, because she does not have the necessary Near
token balance to purchase the gas.
With meta transactions, Alice can create a DelegateAction, which is very
similar to a transaction. It also contains a list of actions to execute and a
single receiver for those actions. She signs the DelegateAction and forwards
it (off-chain) to a relayer. The relayer wraps it in a transaction, of which the
relayer is the signer and therefore pays the gas costs. If the inner actions
have an attached token balance, this is also paid for by the relayer.
On chain, the SignedDelegateAction inside the transaction is converted to an
action receipt with the same SignedDelegateAction on the relayer's shard. The
receipt is forwarded to the account from Alice, which will unpacked the
SignedDelegateAction and verify that it is signed by Alice with a valid Nonce
etc. If all checks are successful, a new action receipt with the inner actions
as body is sent to FT. There, the ft_transfer call finally executes.
Relayer
Meta transactions only work with a relayer. This is an application layer
concept, implemented off-chain. Think of it as a server that accepts a
SignedDelegateAction, does some checks on them and eventually forwards it
inside a transaction to the blockchain network.
A relayer may choose to offer their service for free but that's not going to be financially viable long-term. But they could easily have the user pay using other means, outside of Near blockchain. And with some tricks, it can even be paid using fungible tokens on Near.
In the example visualized above, the payment is done using $FT. Together with
the transfer to John, Alice also adds an action to pay 0.1 $FT to the relayer.
The relayer checks the content of the SignedDelegateAction and only processes
it if this payment is included as the first action. In this way, the relayer
will be paid in the same transaction as John.
Note that the payment to the relayer is still not guaranteed. It could be that Alice does not have sufficient FT balance of Alice first.
Unfortunately, this still does not guarantee that the balance will be high enough once the meta transaction executes. The relayer could waste NEAR gas without compensation if Alice somehow reduces her $FT balance in just the right moment. Some level of trust between the relayer and its user is therefore required.
The vision here is that there will be mostly application-specific relayers. A general-purpose relayer is difficult to implement with just the MVP. See limitations below.
Limitation: Single receiver
A meta transaction, like a normal transaction, can only have one receiver. It's possible to chain additional receipts afterwards. But crucially, there is no atomicity guarantee and no roll-back mechanism.
For normal transactions, this has been widely accepted as a fact for how Near Protocol works. For meta transactions, there was a discussion around allowing multiple receivers with separate lists of actions per receiver. While this could be implemented, it would only create a false sense of atomicity. Since each receiver would require a separate action receipt, there is no atomicity, the same as with chains of receipts.
Unfortunately, this means the trick to compensate the relayer in the same meta
transaction as the serviced actions only works if both happen on the same
receiver. In the example, both happen on FT and this case works well. But it
would not be possible to send $FT1 and pay the relayer in $FT2. Nor could one
deploy a contract code on Alice and pay in $FT in one meta transaction. It
would require two separate meta transactions to do that. Due to timing problems,
this again requires some level of trust between the relayer and Alice.
A potential solution could involve linear dependencies between the action receipts spawned from a single meta transaction. Only if the first succeeds, will the second start executing, and so on. But this quickly gets too complicated for the MVP and is therefore left open for future improvements.
Constraints on the actions inside a meta transaction
A transaction is only allowed to contain one single delegate action. Nested delegate actions are disallowed and so are delegate actions next to each other in the same receipt.
Nested delegate actions have no known use case and it would be complicated to implement. Consequently, it was omitted.
For delegate actions beside each other, there was a bit of back and forth during the NEP-366 design phase. The potential use case here is essentially the same as having multiple receivers in a delegate action. Naturally, it runs into all the same complications (false sense of atomicity) and ends with the same conclusion: Omitted from the MVP and left open for future improvement.
Limitation: Accounts must be initialized
Any transaction, including meta transactions, must use NONCEs to avoid replay attacks. The NONCE must be chosen by Alice and compared to a NONCE stored on chain. This NONCE is stored on the access key information that gets initialized when creating an account.
Implicit accounts don't need to be initialized in order to receive NEAR tokens, or even FT but no NONCE is stored on chain for them. This is problematic because we want to enable this exact use case with meta transactions, but we have no NONCE to create a meta transaction.
For the MVP, the proposed solution, or work-around, is that the relayer will
have to initialize the account of Alice once if it does not exist. Note that
this cannot be done as part of the meta transaction. Instead, it will be a
separate transaction that executes first. Only then can Alice even create a
SignedDelegateAction with a valid NONCE.
Once again, some trust is required. If Alice wanted to abuse the relayer's helpful service, she could ask the relayer to initialize her account. Afterwards, she does not sign a meta transaction, instead she deletes her account and cashes in the small token balance reserved for storage. If this attack is repeated, a significant amount of tokens could be stolen from the relayer.
One partial solution suggested here was to remove the storage staking cost from accounts. This means there is no financial incentive for Alice to delete her account. But it does not solve the problem that the relayer has to pay for the account creation and Alice can simply refuse to send a meta transaction afterwards. In particular, anyone creating an account would have financial incentive to let a relayer create it for them instead of paying out of their own pockets. This would still be better than Alice stealing tokens but fundamentally, there still needs to be some trust.
An alternative solution discussed is to do NONCE checks on the relayer's access key. This prevents replay attacks and allows implicit accounts to be used in meta transactions without even initializing them. The downside is that meta transactions share the same NONCE counter(s). That means, a meta transaction sent by Bob may invalidate a meta transaction signed by Alice that was created and sent to the relayer at the same time. Multiple access keys by the relayer and coordination between relayer and user could potentially alleviate this problem. But for the MVP, nothing along those lines has been approved.
Gas costs for meta transactions
Meta transactions challenge the traditional ways of charging gas for actions. To see why, let's first list the normal flow of gas, outside of meta transactions.
- Gas is purchased (by deducting NEAR from the transaction signer account),
when the transaction is converted into a receipt. The amount of gas is
implicitly defined by the content of the receipt. For function calls, the
caller decides explicitly how much gas is attached on top of the minimum
required amount. The NEAR token price per gas unit is dynamically adjusted on
the blockchain. In today's nearcore code base, this happens as part of
verify_and_charge_transactionwhich gets called inprocess_transaction. - For all actions listed inside the transaction, the
SENDcost is burned immediately. Depending on the conditionsender == receiver, one of two possibleSENDcosts is chosen. TheEXECcost is not burned, yet. But it is implicitly part of the transaction cost. The third and last part of the transaction cost is the gas attached to function calls. The attached gas is also called prepaid gas. (Not to be confused withtotal_prepaid_exec_feeswhich is the implicitly prepaid gas forEXECaction costs.) - On the receiver shard,
EXECcosts are burned before the execution of an action starts. Should the execution fail and abort the transaction, the remaining gas will be refunded to the signer of the transaction.
Ok, now adapt for meta transactions. Let's assume Alice uses a relayer to execute actions with Bob as the receiver.
- The relayer purchases the gas for all inner actions, plus the gas for the delegate action wrapping them.
- The cost of sending the inner actions and the delegate action from the
relayer to Alice's shard will be burned immediately. The condition
relayer == Alicedetermines which actionSENDcost is taken (sirornot_sir). Let's call thisSEND(1). - On Alice's shard, the delegate action is executed, thus the
EXECgas cost for it is burned. Alice sends the inner actions to Bob's shard. Therefore, we burn theSENDfee again. This time based onAlice == Bobto figure outsirornot_sir. Let's call thisSEND(2). - On Bob's shard, we execute all inner actions and burn their
EXECcost.
Each of these steps should make sense and not be too surprising. But the
consequence is that the implicit costs paid at the relayer's shard are
SEND(1) + SEND(2) + EXEC for all inner actions plus SEND(1) + EXEC for
the delegate action. This might be surprising but hopefully with this
explanation it makes sense now!
Gas refunds in meta transactions
Gas refund receipts work exactly like for normal transaction. At every step, the difference between the pessimistic gas price and the actual gas price at that height is computed and refunded. At the end of the last step, additionally all remaining gas is also refunded at the original purchasing price. The gas refunds go to the signer of the original transaction, in this case the relayer. This is only fair, since the relayer also paid for it.
Balance refunds in meta transactions
Unlike gas refunds, the protocol sends balance refunds to the predecessor (a.k.a. sender) of the receipt. This makes sense, as we deposit the attached balance to the receiver, who has to explicitly reattach a new balance to new receipts they might spawn.
In the world of meta transactions, this assumption is also challenged. If an inner action requires an attached balance (for example a transfer action) then this balance is taken from the relayer.
The relayer can see what the cost will be before submitting the meta transaction
and agrees to pay for it, so nothing wrong so far. But what if the transaction
fails execution on Bob's shard? At this point, the predecessor is Alice and
therefore she receives the token balance refunded, not the relayer. This is
something relayer implementations must be aware of since there is a financial
incentive for Alice to submit meta transactions that have high balances attached
but will fail on Bob's shard.
Function access keys in meta transactions
Assume alice sends a meta transaction and signs with a function access key. How exactly are permissions applied in this case?
Function access keys can limit the allowance, the receiving contract, and the contract methods. The allowance limitation acts slightly strange with meta transactions.
But first, both the methods and the receiver will be checked as expected. That is, when the delegate action is unwrapped on Alice's shard, the access key is loaded from the DB and compared to the function call. If the receiver or method is not allowed, the function call action fails.
For allowance, however, there is no check. All costs have been covered by the relayer. Hence, even if the allowance of the key is insufficient to make the call directly, indirectly through meta transaction it will still work.
This behavior is in the spirit of allowance limiting how much financial resources the user can use from a given account. But if someone were to limit a function access key to one trivial action by setting a very small allowance, that is circumventable by going through a relayer. An interesting twist that comes with the addition of meta transactions.
Serialization: Borsh, Json, ProtoBuf
If you spent some time looking at NEAR code, you’ll notice that we have different methods of serializing structures into strings. So in this article, we’ll compare these different approaches, and explain how and where we’re using them.
ProtocolSchema
All structs which need to be persisted or sent over the network must derive the ProtocolSchema trait:
#![allow(unused)] fn main() { // Import schema calculation functionality by putting in Cargo.toml: // near-schema-checker-lib.workspace = true [features] protocol_schema = [ "near-schema-checker-lib/protocol_schema", ...the same feature in all dependent crates... ] // Then, mark your struct with `#[derive(ProtocolSchema)]`: use near_schema_checker_lib::ProtocolSchema; #[derive(ProtocolSchema)] pub struct BlockHeader { pub hash: CryptoHash, pub height: BlockHeight, } // Lastly, mark your crate in `tools/protocol-schema-check/Cargo.toml` // as dependency with `protocol_schema` feature enabled. }
This is done to protect structures from accidental changes that could corrupt the database or disrupt the protocol. Dedicated CI check is responsible to check the consistency of the schema. See README for more details.
All these structures are likely to implement BorshSerialize and BorshDeserialize (see below).
Borsh
Borsh is our custom serializer (link), that we use mostly for things that have to be hashed.
The main feature of Borsh is that, there are no two binary representations that deserialize into the same object.
You can read more on how Borsh serializes the data, by looking at the Specification tab on borsh.io.
The biggest pitfall/risk of Borsh, is that any change to the structure, might cause previous data to no longer be parsable.
For example, inserting a new enum ‘in the middle’:
#![allow(unused)] fn main() { pub enum MyCar { Bmw, Ford, } If we change our enum to this: pub enum MyCar { Bmw, Citroen, Ford, // !! WRONG - Ford objects cannot be deserialized anymore } }
This is especially tricky if we have conditional compilation:
#![allow(unused)] fn main() { pub enum MyCar { Bmw, #[cfg(feature = "french_cars")] Citroen, Ford, } }
Is such a scenario - some of the objects created by binaries with this feature enabled, will not be parsable by binaries without this feature.
Removing and adding fields to structures is also dangerous.
Basically - the only ‘safe’ thing that you can do with Borsh - is add a new Enum value at the end.
JSON
JSON doesn’t need much introduction. We’re using it for external APIs (jsonrpc) and configuration. It is a very popular, flexible and human-readable format.
Proto (Protocol Buffers)
We started using proto recently - and we plan to use it mostly for our network communication. Protocol buffers are strongly typed - they require you to create a .proto file, where you describe the contents of your message.
For example:
message HandshakeFailure {
// Reason for rejecting the Handshake.
Reason reason = 1;
// Data about the peer.
PeerInfo peer_info = 2;
// GenesisId of the NEAR chain that the peer belongs to.
GenesisId genesis_id = 3;
}
Afterwards, such a proto file is fed to protoc ‘compiler’ that returns auto-generated code (in our case Rust code) - that can be directly imported into your library.
The main benefit of protocol buffers is their backwards compatibility (as long as you adhere to the rules and don’t reuse the same field ids).
Summary
So to recap what we’ve learned:
JSON - mostly used for external APIs - look for serde::Serialize/Deserialize
Proto - currently being developed to be used for network connections - objects have to be specified in proto file.
Borsh - for things that we hash (and currently also for all the things that we store on disk - but we might move to proto with this in the future). Look for BorshSerialize/BorshDeserialize
Questions
Why don’t you use JSON for everything?
While this is a tempting option, JSON has a few drawbacks:
- size (json is self-describing, so all the field names etc are included every time)
- non-canonical: JSON doesn’t specify strict ordering of the fields, so we’d have to do additional restrictions/rules on that - otherwise the same ‘conceptual’ message would end up with different hashes.
Ok - so how about proto for everything?
There are couple risks related with using proto for things that have to be hashed. A Serialized protocol buffer can contain additional data (for example fields with tag ids that you’re not using) and still successfully parse (that’s how it achieves backward compatibility).
For example, in this proto:
message First {
string foo = 1;
string bar = 2;
}
message Second {
string foo = 1;
}
Every ‘First’ message will be successfully parsed as ‘Second’ message - which could lead to some programmatic bugs.
Advanced section - RawTrieNode
There is one more place in the code where we use a ‘custom’ encoding:
RawTrieNodeWithSize defined in store/src/trie/raw_node.rs. While the format
uses Borsh derives and API, there is a difference in how branch children
([Option<CryptoHash>; 16]) are encoded. Standard Borsh encoding would
encode Option<CryptoHash> sixteen times. Instead, RawTrieNodeWithSize uses
a bitmap to indicate which elements are set resulting in a different layout.
Imagine a children vector like this:
#![allow(unused)] fn main() { [Some(0x11), None, Some(0x12), None, None, …] }
Here, we have children at index 0 and 2 which has a bitmap of 101
Custom encoder:
// Number of children determined by the bitmask
[16 bits bitmask][32 bytes child][32 bytes child]
[5][0x11][0x12]
// Total size: 2 + 32 + 32 = 68 bytes
Borsh:
[8 bits - 0 or 1][32 bytes child][8 bits 0 or 1][8 bits ]
[1][0x11][0][1][0x11][0][0]...
// Total size: 16 + 32 + 32 = 80 bytes
Code for encoding children is given in BorshSerialize implementation for ChildrenRef type and code for decoding in BorshDeserialize implementation for Children. All of that is in aforementioned store/src/trie/raw_node.rs file.
Proofs
“Don’t trust, but verify” - let’s talk about proofs
Was your transaction included?
How do you know that your transaction was actually included in the blockchain? Sure, you can “simply” ask the RPC node, and it might say “yes”, but is it enough?
The other option would be to ask many nodes - hoping that at least one of them would be telling the truth. But what if that is not enough?
The final solution would be to run your own node - this way you’d check all the transactions yourself, and then you could be sure - but this can become a quite expensive endeavor - especially when many shards are involved.
But there is actually a better solution - that doesn’t require you to trust the single (or many) RPC nodes, and to verify, by yourself, that your transaction was actually executed.
Let’s talk about proofs (merkelization)
Imagine you have 4 values that you’d like to store, in such a way, that you can easily prove that a given value is present.

One way to do it, would be to create a binary tree, where each node would hold a hash:
- leaves would hold the hashes that represent the hash of the respective value.
- internal nodes would hold the hash of “concatenation of hashes of their children”
- the top node would be called a root node (in this image it is the node n7)
With such a setup, you can prove that a given value exists in this tree, by providing a “path” from the corresponding leaf to the root, and including all the siblings.
For example to prove that value v[1] exists, we have to provide all the nodes marked as green, with the information about which sibling (left or right) they are:

# information needed to verify that node v[1] is present in a tree
# with a given root (n7)
[(Left, n0), (Right, n6)]
# Verification
assert_eq!(root, hash(hash(n0, hash(v[1])), n6))
We use the technique above (called merkelization) in a couple of places in our protocol, but for today’s article, I’d like to focus on receipts & outcome roots.
Merkelization, receipts and outcomes
In order to prove that a given receipt belongs to a given block, we will need to fetch some additional information.
As NEAR is sharded, the receipts actually belong to “Chunks” not Blocks
themselves, so the first step is to find the correct chunk and fetch its
ChunkHeader.
ShardChunkHeaderV3 {
inner: V2(
ShardChunkHeaderInnerV2 {
prev_block_hash: `C9WnNCbNvkQvnS7jdpaSGrqGvgM7Wwk5nQvkNC9aZFBH`,
prev_state_root: `5uExpfRqAoZv2dpkdTxp1ZMcids1cVDCEYAQwAD58Yev`,
outcome_root: `DBM4ZsoDE4rH5N1AvCWRXFE9WW7kDKmvcpUjmUppZVdS`,
encoded_merkle_root: `2WavX3DLzMCnUaqfKPE17S1YhwMUntYhAUHLksevGGfM`,
encoded_length: 425,
height_created: 417,
shard_id: 0,
gas_used: 118427363779280,
gas_limit: 1000000000000000,
balance_burnt: 85084341232595000000000,
outgoing_receipts_root: `4VczEwV9rryiVSmFhxALw5nCe9gSohtRpxP2rskP3m1s`,
tx_root: `11111111111111111111111111111111`,
validator_proposals: [],
},
),
}
The field that we care about is called outcome_root. This value represents the
root of the binary merkle tree, that is created based on all the receipts that
were processed in this chunk.
Note: You can notice that we also have a field here called
encoded_merkle_root - this is another case where we use merkelization in our
chain - this field is a root of a tree that holds hashes of all the "partial
chunks" into which we split the chunk to be distributed over the network.
So, in order to verify that a given receipt/transaction was really included, we have to compute its hash (see details below), get the path to the root, and voila, we can confirm that it was really included.
But how do we get the siblings on the path to the root? This is actually something that RPC nodes do return in their responses.
If you ever looked closely at NEAR’s tx-status response, you can notice a "proof" section there. For every receipt, you'd see something like this:
proof: [
{
direction: 'Right',
hash: '2wTFCh2phFfANicngrhMV7Po7nV7pr6gfjDfPJ2QVwCN'
},
{
direction: 'Right',
hash: '43ei4uFk8Big6Ce6LTQ8rotsMzh9tXZrjsrGTd6aa5o6'
},
{
direction: 'Left',
hash: '3fhptxeChNrxWWCg8woTWuzdS277u8cWC9TnVgFviu3n'
},
{
direction: 'Left',
hash: '7NTMqx5ydMkdYDFyNH9fxPNEkpgskgoW56Y8qLoVYZf7'
}
]
And the values in there are exactly the siblings (plus info on which side of the tree the sibling is), on the path to the root.
Note: proof section doesn’t contain the root itself and also doesn’t include the hash of the receipt.
[Advanced section]: Let’s look at a concrete example
Imagine that we have the following receipt:
{
block_hash: '7FtuLHR3VSNhVTDJ8HmrzTffFWoWPAxBusipYa2UfrND',
id: '6bdKUtGbybhYEQ2hb2BFCTDMrtPBw8YDnFpANZHGt5im',
outcome: {
executor_id: 'node0',
gas_burnt: 223182562500,
logs: [],
metadata: { gas_profile: [], version: 1 },
receipt_ids: [],
status: { SuccessValue: '' },
tokens_burnt: '0'
},
proof: [
{
direction: 'Right',
hash: 'BWwZ4wHuzaUxdDSrhAEPjFQtDgwzb8K4zoNzfX9A3SkK'
},
{
direction: 'Left',
hash: 'Dpg4nQQwbkBZMmdNYcZiDPiihZPpsyviSTdDZgBRAn2z'
},
{
direction: 'Right',
hash: 'BruTLiGx8f71ufoMKzD4H4MbAvWGd3FLL5JoJS3XJS3c'
}
]
}
Remember that the outcomes of the execution will be added to the NEXT block, so let’s find the next block hash, and the proper chunk.
(in this example, I’ve used the view-state chain from neard)
417 7FtuLHR3VSNhVTDJ8HmrzTffFWoWPAxBusipYa2UfrND | node0 | parent: 416 C9WnNCbNvkQvnS7jdpaSGrqGvgM7Wwk5nQvkNC9aZFBH | .... 0: E6pfD84bvHmEWgEAaA8USCn2X3XUJAbFfKLmYez8TgZ8 107 Tgas |1: Ch1zr9TECSjDVaCjupNogLcNfnt6fidtevvKGCx8c9aC 104 Tgas |2: 87CmpU6y7soLJGTVHNo4XDHyUdy5aj9Qqy4V7muF5LyF 0 Tgas |3: CtaPWEvtbV4pWem9Kr7Ex3gFMtPcKL4sxDdXD4Pc7wah 0 Tgas
418 J9WQV9iRJHG1shNwGaZYLEGwCEdTtCEEDUTHjboTLLmf | node0 | parent: 417 7FtuLHR3VSNhVTDJ8HmrzTffFWoWPAxBusipYa2UfrND | .... 0: 7APjALaoxc8ymqwHiozB5BS6mb3LjTgv4ofRkKx2hMZZ 0 Tgas |1: BoVf3mzDLLSvfvsZ2apPSAKjmqNEHz4MtPkmz9ajSUT6 0 Tgas |2: Auz4FzUCVgnM7RsQ2noXsHW8wuPPrFxZToyLaYq6froT 0 Tgas |3: 5ub8CZMQmzmZYQcJU76hDC3BsajJfryjyShxGF9rzpck 1 Tgas
I know that the receipt should belong to Shard 3 so let’s fetch the chunk header:
neard view-state chunks --chunk-hash 5ub8CZMQmzmZYQcJU76hDC3BsajJfryjyShxGF9rzpck
ShardChunkHeaderV3 {
inner: V2(
ShardChunkHeaderInnerV2 {
prev_block_hash: `7FtuLHR3VSNhVTDJ8HmrzTffFWoWPAxBusipYa2UfrND`,
prev_state_root: `6rtfqVEXx5STLv5v4zwLVqAfq1aRAvLGXJzZPK84CPpa`,
outcome_root: `2sZ81kLj2cw5UHTjdTeMxmaWn2zFeyr5pFunxn6aGTNB`,
encoded_merkle_root: `6xxoqYzsgrudgaVRsTV29KvdTstNYVUxis55KNLg6XtX`,
encoded_length: 8,
height_created: 418,
shard_id: 3,
gas_used: 1115912812500,
gas_limit: 1000000000000000,
balance_burnt: 0,
outgoing_receipts_root: `8s41rye686T2ronWmFE38ji19vgeb6uPxjYMPt8y8pSV`,
tx_root: `11111111111111111111111111111111`,
validator_proposals: [],
},
),
height_included: 0,
signature: ed25519:492i57ZAPggqWEjuGcHQFZTh9tAKuQadMXLW7h5CoYBdMRnfY4g7A749YNXPfm6yXnJ3UaG1ahzcSePBGm74Uvz3,
hash: ChunkHash(
`5ub8CZMQmzmZYQcJU76hDC3BsajJfryjyShxGF9rzpck`,
),
}
So the outcome_root is 2sZ81kLj2cw5UHTjdTeMxmaWn2zFeyr5pFunxn6aGTNB - let’s
verify it then.
Our first step is to compute the hash of the receipt, which is equal to
hash([receipt_id, hash(borsh(receipt_payload)])
# this is a borsh serialized ExecutionOutcome struct.
# computing this, we leave as an exercise for the reader :-)
receipt_payload_hash = "7PeGiDjssz65GMCS2tYPHUm6jYDeBCzpuPRZPmLNKSy7"
receipt_hash = base58.b58encode(hashlib.sha256(struct.pack("<I", 2) + base58.b58decode("6bdKUtGbybhYEQ2hb2BFCTDMrtPBw8YDnFpANZHGt5im") + base58.b58decode(receipt_payload_hash)).digest())
And then we can start reconstructing the tree:
def combine(a, b):
return hashlib.sha256(a + b).digest()
# one node example
# combine(receipt_hash, "BWwZ4wHuzaUxdDSrhAEPjFQtDgwzb8K4zoNzfX9A3SkK")
# whole tree
combine(combine("Dpg4nQQwbkBZMmdNYcZiDPiihZPpsyviSTdDZgBRAn2z", combine(receipt_hash, "BWwZ4wHuzaUxdDSrhAEPjFQtDgwzb8K4zoNzfX9A3SkK")), "BruTLiGx8f71ufoMKzD4H4MbAvWGd3FLL5JoJS3XJS3c")
# result == 2sZ81kLj2cw5UHTjdTeMxmaWn2zFeyr5pFunxn6aGTNB
And success - our result is matching the outcome root, so it means that our receipt was indeed processed by the blockchain.
Resharding V2
DISCLAIMER: This document describes Resharding V2 and it may not be up to date with recent changes to nearcore.
Resharding
Resharding is the process in which the shard layout changes. The primary purpose of resharding is to keep the shards small so that a node meeting minimum hardware requirements can safely keep up with the network while tracking some set minimum number of shards.
Specification
The resharding is described in more detail in the following NEPs:
Shard layout
The shard layout determines the number of shards and the assignment of accounts to shards (as single account cannot be split between shards).
There are two versions of the ShardLayout enum.
- v0 - maps the account to a shard taking hash of the account id modulo number of shards
- v1 - maps the account to a shard by looking at a set of predefined boundary accounts and selecting the shard where the accounts fits by using alphabetical order
At the time of writing there are three pre-defined shard layouts but more can be added in the future.
- v0 - The first shard layout that contains only a single shard encompassing all the accounts.
- simple nightshade - Splits the accounts into 4 shards.
- simple nightshade v2 - Splits the accounts into 5 shards.
IMPORTANT: Using alphabetical order applies to the full account name, so a.near could belong to
shard 0, while z.a.near to shard 3.
Currently in mainnet & testnet, we use the fixed shard split (which is defined in get_simple_nightshade_layout):
vec!["aurora", "aurora-0", "kkuuue2akv_1630967379.near"]
In the near future we are planning on switching to simple nightshade v2 (which is defined in get_simple_nightshade_layout_v2)
vec!["aurora", "aurora-0", "kkuuue2akv_1630967379.near", "tge-lockup.sweat"]
Shard layout changes
Shard Layout is determined at epoch level in the AllEpochConfig based on the protocol version of the epoch.
The shard layout can change at the epoch boundary. Currently in order to change the
shard layout it is necessary to manually determine the new shard layout and setting it
for the desired protocol version in the AllEpochConfig.
Deeper technical details
It all starts in preprocess_block - if the node sees, that the block it is
about to preprocess is the first block of the epoch (X+1) - it calls
get_state_sync_info, which is responsible for figuring out which shards will
be needed in next epoch (X+2).
This is the moment, when node can request new shards that it didn't track before (using StateSync) - and if it detects that the shard layout would change in the next epoch, it also involves the StateSync - but skips the download part (as it already has the data) - and starts from resharding.
StateSync in this phase would send the ReshardingRequest to the SyncJobsActor (you can think about the SyncJobsActor as a background thread).
We'd use the background thread to perform resharding: the goal is to change the one trie (that represents the state of the current shard) - to multiple tries (one for each of the new shards).
In order to split a trie into children tries we use a snapshot of the flat storage. We iterate over all of the entries in the flat storage and we build the children tries by inserting the parent entry into either of the children tries.
Extracting of the account from the key happens in parse_account_id_from_raw_key - and we do it for all types of data that we store in the trie (contract code, keys, account info etc) EXCEPT for Delayed receipts. Then, we figure out the shard that this account is going to belong to, and we add this key/value to that new trie.
This way, after going over all the key/values from the original trie, we end up with X new tries (one for each new shard).
IMPORTANT: in the current code, we only support such 'splitting' (so a new shard can have just one parent).
Why delayed receipts are special?
For all the other columns, there is no dependency between entries, but in case of delayed receipts - we are forming a 'queue'. We store the information about the first index and the last index (in DelayedReceiptIndices struct).
Then, when receipt arrives, we add it as the 'DELAYED_RECEIPT + last_index' key (and increment last_index by 1).
That is why we cannot move this trie entry type in the same way as others where account id is part of the key. Instead we do it by iterating over this queue and inserting entries to the queue of the relevant child shard.
Constraints
The state sync of the parent shard, the resharding and the catchup of the children shards must all complete within a single epoch.
Rollout
Flow
The resharding will be initiated by having it included in a dedicated protocol version together with neard. Here is the expected flow of events:
- A new neard release is published and protocol version upgrade date is set to D, roughly a week from the release.
- All node operators upgrade their binaries to the newly released version within the given time frame, ideally as soon as possible but no later than D.
- The protocol version upgrade voting takes place at D in an epoch E and nodes vote in favour of switching to the new protocol version in epoch E+2.
- The resharding begins at the beginning of epoch E+1.
- The network switches to the new shard layout in the first block of epoch E+2.
Monitoring
Resharding exposes a number of metrics and logs that allow for monitoring the resharding process as it is happening. Resharding requires manual recovery in case anything goes wrong and should be monitored in order to ensure smooth node operation.
- near_resharding_status is the primary metric that should be used for tracking the progress of resharding. It's tagged with a shard_uid label of the parent shard. It's set to corresponding ReshardingStatus enum and can take one of the following values
- 0 - Scheduled - resharding is scheduled and waiting to be executed.
- 1 - Building - resharding is running. Only one shard at a time can be in that state while the rest will be either finished or waiting in the Scheduled state.
- 2 - Finished - resharding is finished.
- -1 - Failed - resharding failed and manual recovery action is required. The node will operate as usual until the end of the epoch but will then stop being able to process blocks.
- near_resharding_batch_size and near_resharding_batch_count - those two metrics show how much data has been resharded. Both metrics should progress with the near_resharding_status as follows.
- While in the Scheduled state both metrics should remain 0.
- While in the Building state both metrics should be gradually increasing.
- While in the Finished state both metrics should remain at the same value.
- near_resharding_batch_prepare_time_bucket, near_resharding_batch_apply_time_bucket and near_resharding_batch_commit_time_bucket - those three metrics can be used to track the performance of resharding and fine tune throttling if needed. As a rule of thumb the combined time of prepare, apply and commit for a batch should remain at the 100ms-200ms level on average. Higher batch processing time may lead to disruptions in block processing, missing chunks and blocks.
Here are some example metric values when finished for different shards and networks. The duration column reflects the duration of the building phase. Those were captured in production like environment in November 2023 and actual times at the time of resharding in production may be slightly higher.
| mainnet | duration | batch count | batch size |
|---|---|---|---|
| total | 2h23min | ||
| shard 0 | 32min | 12,510 | 6.6GB |
| shard 1 | 30min | 12,203 | 6.1GB |
| shard 2 | 26min | 10,619 | 6.0GB |
| shard 3 | 55min | 21,070 | 11.5GB |
| testnet | duration | batch count | batch size |
|---|---|---|---|
| total | 5h32min | ||
| shard 0 | 21min | 10,259 | 10.9GB |
| shard 1 | 18min | 7,034 | 3.5GB |
| shard 2 | 2h31min | 75,529 | 75.6GB |
| shard 3 | 2h22min | 63,621 | 49.2GB |
Here is an example of what that may look like in a grafana dashboard. Please keep in mind that the values and duration is not representative as the sample data below is captured in a testing environment with different configuration.
Throttling
The resharding process can be quite resource intensive and affect the regular operation of a node. In order to mitigate that as well as limit any need for increasing hardware specifications of the nodes throttling was added. Throttling slows down resharding to not have it impact other node operations. Throttling can be configured by adjusting the resharding_config in the node config file.
- batch_size - controls the size of batches in which resharding moves data around. Setting a smaller batch size will slow down the resharding process and make it less resource-consuming.
- batch_delay - controls the delay between processing of batches. Setting a smaller batch delay will speed up the resharding process and make it more resource-consuming.
The remaining fields in the ReshardingConfig are only intended for testing purposes and should remain set to their default values.
The default configuration for ReshardingConfig should provide a good and safe setting for resharding in the production networks. There is no need for node operators to make any changes to it unless they observe issues.
The resharding config can be adjusted at runtime, without restarting the node. The config needs to be updated first and then a SIGHUP signal should be sent to the neard process. When received the signal neard will update the config and print a log message showing what fields were changed. It's recommended to check the log to make sure the relevant config change was correctly picked up.
Future possibilities
Localize resharding to a single shard
Currently when resharding we need to move the data for all shards even if only a single shard is being split. That is due to having the version field in the storage key that needs to be updated when changing shard layout version.
This can be improved by changing how ShardUId works e.g. removing the version and instead using globally unique shard ids.
Dynamic resharding
The current implementation relies on having the shard layout determined offline and manually added to the node implementation.
The dynamic resharding would mean that the network itself can automatically determine that resharding is needed, what should be the new shard layout and schedule the resharding.
Support different changes to shard layout
The current implementation only supports splitting a shard. In the future we can consider adding support for other operations such as merging two shards or moving an existing boundary account.
Optimistic block
This short document will tell you about what optimistic block is and why it was introduced with protocol version 77.
Improving Stateless Validation Latency with Optimistic Block
Why 2× Latency Existed Before v77 — and How the Idea of Optimistic Block Emerged
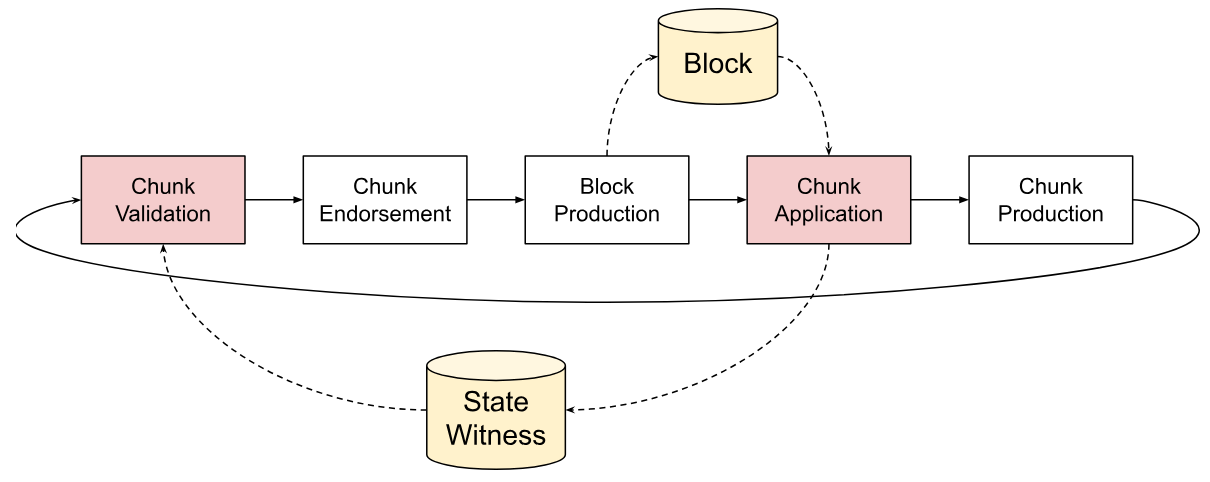
In this diagram: yellow = data; rectangle = process. Arrow = dependency on a process; dashed arrow = production and dependency on data.
This was the critical path between two consecutive blocks. The two red blocks are the slow parts. It's better to have only one of them on the critical path.
- Chunk production could be skipped and as validation of the state witness can be done as soon as the chunk producer finishes applying the chunk. But that doesn’t help with 2x latency.
- Chunk validation necessarily depend on chunk application to produce the state witness, so there’s no way to parallelize chunk application with the chunk validation of the next chunk
- The best you can do is stream that data, but that’s complicated.
- If they cannot be stacked this way, only option is to stack them the other way: apply a chunk while validating the same chunk.
- But now the challenge is: chunk application requires the block, and block production is the only way to have the block, but block production depends on chunk endorsement which depends on chunk validation, so how do we break this chain?
Introduction to Optimistic Block
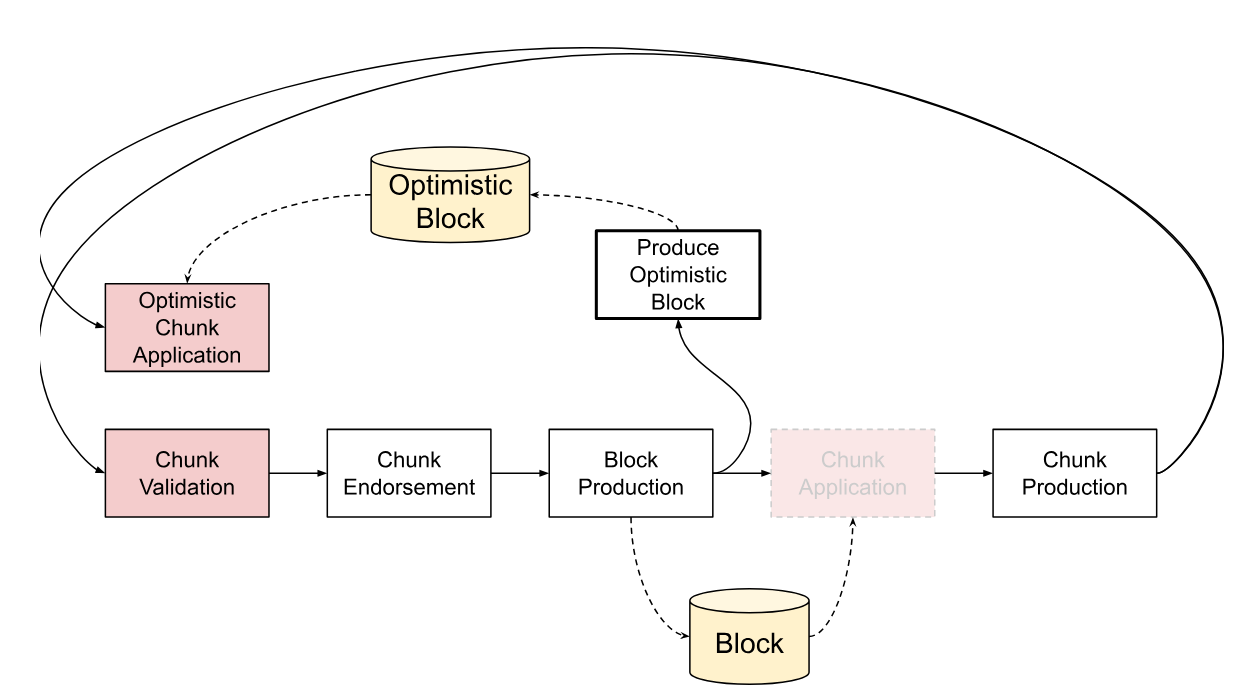
Optimistic Block accelerates chunk execution by speculatively applying chunks before the actual block is finalized. Here's how it works:
- Block production: as soon as the previous block producer produces a block, the new block producer produces an optimistic block.
- The optimistic block contains all parts of the block except those that depend on chunks. That means no chunk headers, no chunk endorsements, but everything else including block height, timestamp, vrf, etc.
- Chunk execution: The chunk producer who is responsible for producing the next chunk and needs to apply the just produced chunk of the same shard, listens to the ShardsManager for other chunks with the same parent. As soon as it receives chunks from all other shards (if it happens before the new block is received), and it also receives the optimistic block, it starts applying the chunk optimistically.
- As a reminder, applying a chunk requires the block that the chunk is in, for two reasons:
- The runtime requires several fields from the block: block height, timestamp, and VRF. These can be obtained from the optimistic block.
- A chunk does not contain the incoming receipts of that shard; rather it contains the outgoing receipts of the previous chunk of that shard. In order to collect the incoming receipts, other chunks in the same block are needed. During optimistic execution, these are obtained from the other chunks that are received via ShardsManager.
- The optimistic chunk application should produce the exact same result as the real chunk application as long as the optimistic block matches all of the real block’s fields, and the chunks used for optimistic application are exactly the chunks included in the real block (in other words, no chunk producer double-signed, and no chunks were missed).
- As a reminder, applying a chunk requires the block that the chunk is in, for two reasons:
- Fallback and safety: It is possible for the optimistic chunk application to incorrectly predict the actual block produced. Therefore, the original chunk application logic still needs to be executed in that case.
- To implement cleanly, the optimistic chunk application shall serve only as a cache for the actual chunk application. It should not write any data or do anything else other than acting as a cache. The actual chunk application always happens except it may be skipped if the inputs match exactly.
- Changes to block timestamp: Note that the way validators choose the block timestamp must be changed, as it needs to be predicted by the time the block producer produces the optimistic block.
- The timestamp is not a critical field; it only needs to be reasonable (tethered to real world time) and monotonically increasing.
- In the current implementation, the current timestamp is used when producing the optimistic block.
- This is not a protocol change as the block producer has freedom in picking this value.
- If optimistic block was produced, the block and optimistic block timestamp must be the same. Otherwise, the optimistic chunk application will be invalidated.
- Backward compatibility: Optimistic block itself is also not a protocol change. It is also very safe as long as the optimistic chunk application’s implementation is consistent with the actual.
How neard will work
The documents under this chapter are talking about the future of NEAR - what we're planning on improving and how.
(This also means that they can get out of date quickly :-).
If you have comments, suggestions or want to help us designing and implementing some of these things here - please reach out on Zulip or github.
This document is still a DRAFT.
This document covers our improvement plans for state sync and catchup. Before reading this doc, you should take a look at How sync works
State sync is used in two situations:
- when your node is behind for more than 2 epochs (and it is not an archival node) - then rather than trying to apply block by block (that can take hours) - you 'give up' and download the fresh state (a.k.a state sync) and apply blocks from there.
- when you're a block (or chunk) producer - and in the upcoming epoch, you'll have to track a shard that you are not currently tracking.
In the past (and currently) - the state sync was mostly used in the first scenario (as all block & chunk producers had to track all the shards for security reasons - so they didn't actually have to do catchup at all).
As we progress towards phase 2 and keep increasing number of shards - the catchup part starts being a lot more critical. When we're running a network with a 100 shards, the single machine is simply not capable of tracking (a.k.a applying all transactions) of all shards - so it will have to track just a subset. And it will have to change this subset almost every epoch (as protocol rebalances the shard-to-producer assignment based on the stakes).
This means that we have to do some larger changes to the state sync design, as requirements start to differ a lot:
- catchups are high priority (the validator MUST catchup within 1 epoch - otherwise it will not be able to produce blocks for the new shards in the next epoch - and therefore it will not earn rewards).
- a lot more catchups in progress (with lots of shards basically every validator would have to catchup at least one shard at each epoch boundary) - this leads to a lot more potential traffic on the network
- malicious attacks & incentives - the state data can be large and can cause a lot of network traffic. At the same time it is quite critical (see point above), so we'll have to make sure that the nodes are incentivize to provide the state parts upon request.
- only a subset of peers will be available to request the state sync from (as not everyone from our peers will be tracking the shard that we're interested in).
Things that we're actively analyzing
Performance of state sync on the receiver side
We're looking at the performance of state sync:
- how long does it take to create the parts,
- pro-actively creating the parts as soon as epoch starts
- creating them in parallel
- allowing user to ask for many at once
- allowing user to provide a bitmask of parts that are required (therefore allowing the server to return only the ones that it already cached).
Better performance on the requestor side
Currently the parts are applied only once all of them are downloaded - instead we should try to apply them in parallel - after each part is received.
When we receive a part, we should announce this information to our peers - so that they know that they can request it from us if they need it.
Ideas - not actively working on them yet
Better networking (a.k.a Tier 3)
Currently our networking code is picking the peers to connect at random (as most of them are tracking all the shards). With phase2 it will no longer be the case, so we should work on improvements of our peer-selection mechanism.
In general - we should make sure that we have direct connection to at least a few nodes that are tracking the same shards that we're tracking right now (or that we'll want to track in the near future).
Dedicated nodes optimized towards state sync responses
The idea is to create a set of nodes that would specialize in state sync responses (similar to how we have archival nodes today).
The sub-idea of this, is to store such data on one of the cloud providers (AWS, GCP).
Sending deltas instead of full state syncs
In case of catchup, the requesting node might have tracked that shard in the past. So we could consider just sending a delta of the state rather than the whole state.
While this helps with the amount of data being sent - it might require the receiver to do a lot more work (as the data that it is about to send cannot be easily cached).
Malicious producers in phase 2 of sharding
In this document, we'll compare the impact of the hypothetical malicious producer on the NEAR system (both in the current setup and how it will work when phase2 is implemented).
Current state (Phase 1)
Let's assume that a malicious chunk producer C1 has produced a bad chunk
and sent it to the block producer at this height B1.
The block producer IS going to add the chunk to the block (as we don't validate the chunks before adding to blocks - but only when signing the block - see Transactions and receipts - last section).
After this block is produced, it is sent to all the validators to get the signatures.
As currently all the validators are tracking all the shards - they will quickly notice that the chunk is invalid, so they will not sign the block.
Therefore the next block producer B2 is going to ignore B1's block, and
select block from B0 as a parent instead.
So TL;DR - a bad chunk would not be added to the chain.
Phase 2 and sharding
Unfortunately things get a lot more complicated, once we scale.
Let's assume the same setup as above (a single chunk producer C1 being
malicious). But this time, we have 100 shards - each validator is tracking just
a few (they cannot track all - as today - as they would have to run super
powerful machines with > 100 cores).
So in the similar scenario as above - C1 creates a malicious chunks, and
sends it to B1, which includes it in the block.
And here's where the complexity starts - as most of the validators will NOT
track the shard which C1 was producing - so they will still sign the block.
The validators that do track that shard will of course (assuming that they are non-malicious) refuse the sign. But overall, they will be a small majority - so the block is going to get enough signatures and be added to the chain.
Challenges, Slashing and Rollbacks
So we're in a pickle - as a malicious chunk was just added to the chain. And that's why need to have mechanisms to automatically recover from such situations: Challenges, Slashing and Rollbacks.
Challenge
Challenge is a self-contained proof, that something went wrong in the chunk processing. It must contain all the inputs (with their merkle proof), the code that was executed, and the outputs (also with merkle proofs).
Such a challenge allows anyone (even nodes that don't track that shard or have any state) to verify the validity of the challenge.
When anyone notices that a current chain contains a wrong transition - they submit such challenge to the next block producer, which can easily verify it and it to the next block.
Then the validators do the verification themselves, and if successful, they sign the block.
When such block is successfully signed, the protocol automatically slashes
malicious nodes (more details below) and initiates the rollback to bring the
state back to the state before the bad chunk (so in our case, back to the block
produced by B0).
Slashing
Slashing is the process of taking away the part of the stake from validators that are considered malicious.
In the example above, we'll definitely need to slash the C1 - and potentially also any validators that were tracking that shard and did sign the bad block.
Things that we'll have to figure out in the future:
- how much do we slash? all of the stake? some part?
- what happens to the slashed stake? is it burned? does it go to some pool?
State rollbacks
// TODO: add
Problems with the current Phase 2 design
Is slashing painful enough?
In the example above, we'd successfully slash the C1 producer - but was it
enough?
Currently (with 4 shards) you need around 20k NEAR to become a chunk producer. If we increase the number of shards to 100, it would drop the minimum stake to around 1k NEAR.
In such scenario, by sacrificing 1k NEAR, the malicious node can cause the system to rollback a couple blocks (potentially having bad impact on the bridge contracts etc).
On the other side, you could be a non-malicious chunk producer with a corrupted database (or a nasty bug in the code) - and the effect would be the same - the chunk that you produced would be marked as malicious, and you'd lose your stake (which will be a super-scary even for any legitimate validator).
So the open question is - can we do something 'smarter' in the protocol to detect the case, where there is 'just a single' malicious (or buggy) chunk producer and avoid the expensive rollback?
Storage
This is our work-in-progress storage documentation. Things are raw and incomplete. You are encouraged to help improve it, in any capacity you can!
Flow
Here we present the flow of a single read or write request from the transaction runtime all the way to the OS. As you can see, there are many layers of read-caching and write-buffering involved.
Blue arrow means a call triggered by read.
Red arrow means a call triggered by write.
Black arrow means a non-trivial data dependency. For example:
- Nodes which are read on TrieStorage go to TrieRecorder to generate proof, so they are connected with black arrow.
- Memtrie lookup needs current state of accounting cache to compute costs. When query completes, accounting cache is updated with memtrie nodes. So they are connected with bidirectional black arrow.
Trie
We use Merkle-Patricia Trie to store blockchain state. Trie is persistent, which means that insertion of new node actually leads to creation of a new path to this node, and thus root of Trie after insertion will also be represented by a new object.
Here we describe its implementation details which are closely related to Runtime.
Main structures
Trie
Trie stores the state - accounts, contract codes, access keys, etc. Each state item corresponds to the unique trie key. You can read more about this structure on Wikipedia.
There are two ways to access trie - from memory and from disk. The first one is currently the main one, where only the loading stage requires disk, and the operations are fully done in memory. The latter one relies only on disk with several layers of caching. Here we describe the disk trie.
Disk trie is stored in the RocksDB, which is persistent across node restarts. Trie
communicates with database using TrieStorage. On the database level, data is
stored in key-value format in DBCol::State column. There are two kinds of
records:
- trie nodes, for the which key is constructed from shard id and
RawTrieNodeWithSizehash, and value is aRawTrieNodeWithSizeserialized by a custom algorithm; - values (encoded contract codes, postponed receipts, etc.), for which the key is constructed from shard id and the hash of value, which maps to the encoded value.
So, value can be obtained from TrieKey as follows:
- start from the hash of
RawTrieNodeWithSizecorresponding to the root; - descend to the needed node using nibbles from
TrieKey; - extract underlying
RawTrieNode; - if it is a
LeaforBranch, it should contain the hash of the value; - get value from storage by its hash and shard id.
Note that Trie is almost never called directly from Runtime, modifications
are made using TrieUpdate.
TrieUpdate
Provides a way to access storage and record changes to commit in the future. Update is prepared as follows:
- changes are made using
setandremovemethods, which are added toprospectivefield, - call
commitmethod which movesprospectivechanges tocommitted, - call
finalizemethod which preparesTrieChangesand state changes based oncommittedfield.
Prospective changes correspond to intermediate state updates, which can be discarded if the transaction is considered invalid (because of insufficient balance, invalidity, etc.). While they can't be applied yet, they must be cached this way if the updated keys are accessed again in the same transaction.
Committed changes are stored in memory across transactions and receipts. Similarly, they must be cached if the updated keys are accessed across transactions. They can be discarded only if the chunk is discarded.
Note that finalize, Trie::insert and Trie::update do not update the
database storage. These functions only modify trie nodes in memory. Instead,
these functions prepare the TrieChanges object, and Trie is actually updated
when ShardTries::apply_insertions is called, which puts new values to
DBCol::State part of the key-value database.
TrieStorage
Stores all Trie nodes and allows to get serialized nodes by TrieKey hash
using the retrieve_raw_bytes method.
There are two major implementations of TrieStorage:
TrieCachingStorage- caches all big values ever read byretrieve_raw_bytes.TrieMemoryPartialStorage- used for validating recorded partial storage.
Note that these storages use database keys, which are retrieved using hashes of
trie nodes using the get_key_from_shard_id_and_hash method.
ShardTries
This is the main struct that is used to access all Tries. There's usually only a single instance of this and it contains stores and caches. We use this to gain access to the Trie for a single shard by calling the get_trie_for_shard or equivalent methods.
Each shard within ShardTries has their own cache and view_cache. The cache stores the most frequently accessed nodes and is usually used during block production. The view_cache is used to serve user request to get data, which usually come in via network. It is a good idea to have an independent cache for this as we can have patterns in accessing user data independent of block production.
Primitives
TrieChanges
Stores result of updating Trie.
old_root: root before updatingTrie, i.e. inserting new nodes and deleting old ones,new_root: root after updatingTrie,insertions,deletions: vectors ofTrieRefcountChange, describing all inserted and deleted nodes.
This way to update trie allows to add new nodes to storage and remove old ones separately. The former corresponds to saving new block, the latter - to garbage collection of old block data which is no longer needed.
TrieRefcountChange
Because we remove unused nodes during garbage collection, we need to track
the reference count (rc) for each node. Another reason is that we can dedup
values. If the same contract is deployed 1000 times, we only store one contract
binary in storage and track its count.
This structure is used to update rc in the database:
trie_node_or_value_hash- hash of the trie node or value, used for uniting with shard id to get DB key,trie_node_or_value- serialized trie node or value,rc- change of reference count.
Note that for all reference-counted records, the actual value stored in DB is
the concatenation of trie_node_or_value and rc. The reference count is
updated using a custom merge operation refcount_merge.
On-Disk Database Format
We store the database in RocksDB. This document is an attempt to give hints about how to navigate it.
RocksDB
- The column families are defined in
DBCol, defined incore/store/src/columns.rs - The column families are seen on the rocksdb side as per the
col_namefunction defined incore/store/src/db/rocksdb.rs
The Trie (col5)
- The trie is stored in column family
State, number 5 - In this family, each key is of the form
ShardUId | CryptoHashwhereShardUId: u64andCryptoHash: [u8; 32]
All Historical State Changes (col35)
- The state changes are stored in column family
StateChanges, number 35 - In this family, each key is of the form
BlockHash | Column | AdditionalInfowhere:BlockHash: [u8; 32]is the block hash for this changeColumn: u8is defined near the top ofcore/primitives/src/trie_key.rsAdditionalInfodepends onColumnand it can be found in the code for theTrieKeystruct, same file asColumn
Contract Deployments
-
Contract deployments happen with
Column = 0x01 -
AdditionalInfois the account id for which the contract is being deployed -
The key value contains the contract code alongside other pieces of data. It is possible to extract the contract code by removing everything until the wasm magic number, 0061736D01000000
-
As such, it is possible to dump all the contracts that were ever deployed on-chain using this command on an archival node:
ldb --db=~/.near/data scan --column_family=col35 --hex | \ grep -E '^0x.{64}01' | \ sed 's/0061736D01000000/x/' | \ sed 's/^.*x/0061736D01000000/' | \ grep -v ' : '(Note that the last grep is required because not every such value appears to contain contract code) We should implement a feature to state-viewer that’d allow better visualization of this data, but in the meantime this seems to work.
High level overview
When mainnet launched, the neard client stored all the chain's state in a single
RocksDB column DBCol::State. This column embeds the entire NEAR state
trie directly in the key-value database, using roughly
hash(borsh_encode(trie_node)) as the key to store a trie_node. This gives a
content-addressed storage system that can easily self-verify.
Flat storage is a bit like a database index for the values stored in the trie. It stores a copy of the data in a more accessible way to speed up the lookup time.
Drastically oversimplified, flat storage uses a hashmap instead of a trie. This
reduces the lookup time from O(d) to O(1) where d is the tree depth of the
value.
But the devil is in the detail. Below is a high-level summary of implementation challenges, which are the reasons why the above description is an oversimplification.
Time dimension of the state
The blockchain state is modified with every chunk. Neard must be able to travel back in time and resolve key lookups for older versions, as well as travel to alternative universes to resolve requests for chunks that belong to a different fork.
Using the full trie embedding in RocksDB, this is almost trivial. We only need to know the state root for a chunk and we can start traversing from the root to any key. As long as we do not delete (garbage collect) unused trie nodes, the data remains available. The overhead is minimal, too, since all the trie nodes that have not been changed are shared between tries.
Enter flat storage territory: A simple hashmap only stores a snapshot. When we write a new value to the same key, the old value is overwritten and no longer accessible. A solution to access different versions on each shard is required.
The minimal solution only tracks the final head and all forks building on top. A full implementation would also allow replaying older chunks and doing view calls. But even this minimal solution pulls in all complicated details regarding consensus and multiplies them with all the problems listed below.
Fear of data corruption
State and FlatState keep a copy of the same data and need to be in sync at all times. This is a source for errors which any implementation needs to test properly. Ideally, there are also tools to quickly compare the two and verify which is correct.
Note: The trie storage is verifiable by construction of the hashes. The flat state is not directly verifiable. But it is possible to reconstruct the full trie just from the leaf values and use that for verification.
Gas accounting requires a protocol change
The trie path we take in a trie lookup affects the gas costs, and hence the balance subtracted from the user. In other words, the lookup algorithm leaks into the protocol. Hence, we cannot switch between different ways of looking up state without a protocol change.
This makes things a whole lot more complicated. We have to do the data migration and prepare flat storage, while still using trie storage. Keeping flat storage up to date at this point is pure overhead. And then, at the epoch switch where the new protocol version begins, we have to start using the new storage in all clients simultaneously. Anyone that has not finished migration, yet, will fail to produce a chunk due to invalid gas results.
In an ideal future, we want to make gas costs independent of the position in the trie and then this would no longer be a problem.
Performance reality check
Going from O(d) to O(1) sounds great. But let's look at actual numbers.
A flat state lookup requires exactly 2 database requests. One for finding the
ValueRef and one for dereferencing the value. (Dereferencing only happens if
the value is present and if enough gas was paid to cover reading the potentially
large value, otherwise we short-circuit.)
A trie lookup requires exactly d trie node lookups where d is the depth in
the trie, plus one more for dereferencing the final value.
Clearly, d + 1 is worse than 1 + 1, right? Well, as it turns out, we can
cache the trie nodes with surprisingly high effectiveness. In mainnet
workloads (which were often optimized to work well with the trie shape) we
observe a 99% cache hit rate in many cases.
Combine that with the fact that a typical value for d is somewhere between 10
and 20. Then we may conclude that, in expectation, a trie lookup (d * 0.01 + 1
requests) requires less DB requests than a flat state lookup (1 + 1 requests).
In practice, however, flat state still has an edge over accessing trie storage directly. And that is due to two reasons.
- DB keys are in better order, leading to more cache hits in RocksDB's block cache.
- The flat state column is much smaller than the state column.
We observed a speedup of 100x and beyond for reading a single value from
DBCol::FlatState compared to reading it from DBCol::State. So that is
clearly a win. But one that is due to the data layout inside RocksDB, not due to
algorithmic improvements.
Updating the Merkle tree
When we update a value in the blockchain state, all ancestor nodes change their value due to the recursive nature of Merkle trees.
Updating flat state is easy enough but then we would not know the new state root. Annoyingly, it is rather important to have the state root in due time, as it is included in the chunk header.
To update the state root, we need to read all nodes between the root and all changed values. At which point, we are doing all the same reads we were trying to avoid in the first place.
This makes flat state for writes algorithmically useless, as we still have to do
O(d) requests, no matter what. But there are potential benefits from data
locality, as flat state stores values sorted by a trie key instead of a
perfectly random hash.
For that, we would need a fast index not only for the state value but also for all intermediate trie nodes. At this point, we would be back to a full embedding of the trie in a key-value store / hashmap. Just changing the keys we use for the database.
Note that we can enjoy the benefits of read-only flat storage to improve read heavy contracts. But a read-modify-write pattern using this hybrid solution is strictly worse than the original implementation without flat storage.
Implementation status and future ideas
As of March 2023, we have implemented a read-only flat storage that only works for the frontier of non-final blocks and the final block itself. Archival calls and view calls still use the trie directly.
Things we have solved
We are fairly confident we have solved the time-travel issues, the data migration / protocol upgrade problems, and got a decent handle on avoiding accidental data corruption.
This improves the worst case (no cache hits) for reads dramatically. And it paves the way for further improvements, as we have now a good understanding of all these seemingly-simple but actually-really-hard problems.
Flat state for writes
How to use flat storage for writes is not fully designed, yet, but we have some rough ideas on how to do it. But we don't know the performance we should expect. Algorithmically, it can only get worse but the speedup on RocksDB we found with the read-only flat storage is promising. But one has to wonder if there are not also simpler ways to achieve better data locality in RocksDB.
Inlining values
We hope to get a jump in performance by avoiding dereferencing ValueRef after
the flat state lookup. At least for small values we could store the value
itself also in flat state. (to be defined what small means)
This seems very promising because the value dereferencing still happens in the
much slower DBCol::State. If we assume small values are the common case, we
would thus expect huge performance improvements for the average case.
It is not clear yet, if we can also optimize large lookups somehow. If not, we could at least charge them at a higher rate than we do today, to reflect the real DB cost better.
Code guide
Here we describe structures used for flat storage implementation.
FlatStorage
This is the main structure which owns information about ValueRefs for all keys from some fixed shard for some set of blocks. It is shared by multiple threads, so it is guarded by RwLock:
- Chain thread, because it sends queries like:
- "new block B was processed by chain" - supported by add_block
- "flat storage head can be moved forward to block B" - supported by update_flat_head
- Thread that applies a chunk, because it sends read queries "what is the ValueRef for key for block B"
- View client (not fully decided)
Requires ChainAccessForFlatStorage on creation because it needs to know the tree of blocks after the flat storage head, to support getting queries correctly.
FlatStorageManager
It holds all FlatStorages which NightshadeRuntime knows about and:
- provides views for flat storage for some fixed block - supported by new_flat_state_for_shard
- sets initial flat storage state for genesis block - set_flat_storage_for_genesis
- adds/removes/gets flat storage if we started/stopped tracking a shard or need to create a view - create_flat_storage_for_shard, etc.
FlatStorageChunkView
Interface for getting ValueRefs from flat storage for some shard for some fixed block, supported by get_ref method.
Other notes
Chain dependency
If storage is fully empty, then we need to create flat storage from scratch. FlatStorage is stored inside NightshadeRuntime, and it itself is stored inside Chain, so we need to create them in the same order and dependency hierarchy should be the same. But at the same time, we parse genesis file only during Chain creation. That’s why FlatStorageManager has set_flat_storage_for_genesis method which is called during Chain creation.
Regular block processing vs. catchups
For these two use cases we have two different flows: first one is handled in Chain.postprocess_block, the second one in Chain.block_catch_up_postprocess. Both, when results of applying chunk are ready, should call Chain.process_apply_chunk_result → RuntimeAdapter.get_flat_storage_for_shard → FlatStorage.add_block, and when results of applying ALL processed/postprocessed chunks are ready, should call RuntimeAdapter.get_flat_storage_for_shard → FlatStorage.update_flat_head.
(because applying some chunk may result in error and we may need to exit there without updating flat head - ?)
This document describes how our network works. At this moment, it is known to be somewhat outdated, as we are in the process of refactoring the network protocol somewhat significantly.
1. Overview
Near Protocol uses its own implementation of a custom peer-to-peer network. Peers who join the network are represented by nodes and connections between them by edges.
The purpose of this document is to describe the inner workings of the near-network
package; and to be used as reference by future engineers to understand the network
code without any prior knowledge.
2. Code structure
near-network runs on top of an actor framework provided by near-async.
Code structure is split between 4 actors
PeerManagerActor, PeerActor, RoutingTableActor, EdgeValidatorActor
2.1 EdgeValidatorActor (currently called EdgeVerifierActor in the code)
EdgeValidatorActor runs on separate thread. The purpose of this actor is to
validate edges, where each edge represents a connection between two peers,
and it's signed with a cryptographic signature of both parties. The process of
edge validation involves verifying cryptographic signatures, which can be quite
expensive, and therefore was moved to another thread.
Responsibilities:
- Validating edges by checking whenever cryptographic signatures match.
2.2 RoutingTableActor
RoutingTableActor maintains a view of the P2P network represented by a set of
nodes and edges.
In case a message needs to be sent between two nodes, that can be done directly
through a TCP connection. Otherwise, RoutingTableActor is responsible for pinging
the best path between them.
Responsibilities:
- Keep set of all edges of
P2P networkcalled routing table. - Connects to
EdgeValidatorActor, and asks for edges to be validated, when needed. - Has logic related to exchanging edges between peers.
2.3 PeerActor
Whenever a new connection gets accepted, an instance of PeerActor gets
created. Each PeerActor keeps a physical TCP connection to exactly one
peer.
Responsibilities:
- Maintaining physical connection.
- Reading messages from peers, decoding them, and then forwarding them to the right place.
- Encoding messages, sending them to peers on physical layer.
- Routing messages between
PeerManagerActorand other peers.
2.4 PeerManagerActor
PeerManagerActor is the main actor of near-network crate. It acts as a
bridge connecting to the world outside, the other peers, and ClientActor and
ClientViewActor, which handle processing any operations on the chain.
PeerManagerActor maintains information about p2p network via RoutingTableActor,
and indirectly, through PeerActor, connections to all nodes on the network.
All messages going to other nodes, or coming from other nodes will be routed
through this Actor. PeerManagerActor is responsible for accepting incoming
connections from the outside world and creating PeerActors to manage them.
Responsibilities:
- Accepting new connections.
- Maintaining the list of
PeerActors, creating, deleting them. - Routing information about new edges between
PeerActorsandRoutingTableManager. - Routing messages between
ViewClient,ViewClientActorandPeerActors, and consequently other peers. - Maintains
RouteBackstructure, which has information on how to send replies to messages.
3. Code flow - initialization
First, the PeerManagerActor actor gets started. PeerManagerActor opens the
TCP server, which listens to incoming connections. It starts the
RoutingTableActor, which then starts the EdgeValidatorActor. When
an incoming connection gets accepted, it starts a new PeerActor
on its own thread.
4. NetworkConfig
near-network reads configuration from NetworkConfig, which is a part of client config.
Here is a list of features read from config:
boot_nodes- list of nodes to connect to on start.addr- listening address.max_num_peers- by default we connect up to 40 peers, current implementation supports up to 128.
5. Connecting to other peers
Each peer maintains a list of known peers. They are stored in the database. If
the database is empty, the list of peers, called boot nodes, will be read from
the boot_nodes option in the config. The peer to connect to is chosen at
random from a list of known nodes by the PeerManagerActor::sample_random_peer
method.
6. Edges & network - in code representation
P2P network is represented by a list of peers, where each peer is
represented by a structure PeerId, which is defined by the peer's public key
PublicKey, and a list of edges, where each edge is represented by the
structure Edge.
Both are defined below.
6.1 PublicKey
We use two types of public keys:
- a 256 bit
ED25519public key. - a 512 bit
Secp256K1public key.
Public keys are defined in the PublicKey enum, which consists of those two
variants.
#![allow(unused)] fn main() { pub struct ED25519PublicKey(pub [u8; 32]); pub struct Secp256K1PublicKey([u8; 64]); pub enum PublicKey { ED25519(ED25519PublicKey), SECP256K1(Secp256K1PublicKey), } }
6.2 PeerId
Each peer is uniquely defined by its PublicKey, and represented by PeerId
struct.
#![allow(unused)] fn main() { pub struct PeerId(PublicKey); }
6.3 Edge
Each edge is represented by the Edge structure. It contains the following:
- pair of nodes represented by their public keys.
nonce- a unique number representing the state of an edge. Starting with1. Odd numbers represent an active edge. Even numbers represent an edge in which one of the nodes, confirmed that the edge is removed.- Signatures from both peers for active edges.
- Signature from one peer in case an edge got removed.
6.4 Graph representation
RoutingTableActor is responsible for storing and maintaining the set of all edges.
They are kept in the edge_info data structure of the type HashSet<Edge>.
#![allow(unused)] fn main() { pub struct RoutingTableActor { /// Collection of edges representing P2P network. /// It's indexed by `Edge::key()` key and can be search through by calling `get()` function /// with `(PeerId, PeerId)` as argument. pub edges_info: HashSet<Edge>, /// ... } }
7. Code flow - connecting to a peer - handshake
When PeerManagerActor starts, it starts to listen to a specific port.
7.1 - Step 1 - monitor_peers_trigger runs
PeerManager checks if we need to connect to another peer by running the
PeerManager::is_outbound_bootstrap_needed method. If true we will try to
connect to a new node. Let's call the current node, node A.
7.2 - Step 2 - choosing the node to connect to
Method PeerManager::sample_random_peer will be called, and it returns node B
that we will try to connect to.
7.3 - Step 3 - OutboundTcpConnect message
PeerManagerActor will send itself a message OutboundTcpConnect in order
to connect to node B.
#![allow(unused)] fn main() { pub struct OutboundTcpConnect { /// Peer information of the outbound connection pub target_peer_info: PeerInfo, } }
7.4 - Step 4 - OutboundTcpConnect message
On receiving the message the handle_msg_outbound_tcp_connect method will be
called, which calls TcpStream::connect to create a new connection.
7.5 - Step 5 - Connection gets established
Once connection with the outgoing peer gets established. The try_connect_peer
method will be called. And then a new PeerActor will be created and started. Once
the PeerActor starts it will send a Handshake message to the outgoing node B
over a tcp connection.
This message contains protocol_version, node A's metadata, as well as all
information necessary to create an Edge.
#![allow(unused)] fn main() { pub struct Handshake { /// Current protocol version. pub(crate) protocol_version: u32, /// Oldest supported protocol version. pub(crate) oldest_supported_version: u32, /// Sender's peer id. pub(crate) sender_peer_id: PeerId, /// Receiver's peer id. pub(crate) target_peer_id: PeerId, /// Sender's listening addr. pub(crate) sender_listen_port: Option<u16>, /// Peer's chain information. pub(crate) sender_chain_info: PeerChainInfoV2, /// Represents new `edge`. Contains only `none` and `Signature` from the sender. pub(crate) partial_edge_info: PartialEdgeInfo, } }
7.6 - Step 6 - Handshake arrives at node B
Node B receives a Handshake message. Then it performs various validation
checks. That includes:
- Check signature of edge from the other peer.
- Whenever
nonceis the edge, send matches. - Check whether the protocol is above the minimum
OLDEST_BACKWARD_COMPATIBLE_PROTOCOL_VERSION. - Other node
view of chainstate.
If everything is successful, PeerActor will send a RegisterPeer message to
PeerManagerActor. This message contains everything needed to add PeerActor
to the list of active connections in PeerManagerActor.
Otherwise, PeerActor will be stopped immediately or after some timeout.
#![allow(unused)] fn main() { pub struct RegisterPeer { pub(crate) actor: Addr<PeerActor>, pub(crate) peer_info: PeerInfo, pub(crate) peer_type: PeerType, pub(crate) chain_info: PeerChainInfoV2, // Edge information from this node. // If this is None it implies we are outbound connection, so we need to create our // EdgeInfo part and send it to the other peer. pub(crate) this_edge_info: Option<EdgeInfo>, // Edge information from other node. pub(crate) other_edge_info: EdgeInfo, // Protocol version of new peer. May be higher than ours. pub(crate) peer_protocol_version: ProtocolVersion, } }
7.7 - Step 7 - PeerManagerActor receives RegisterPeer message - node B
In the handle_msg_consolidate method, the RegisterPeer message will be validated.
If successful, the register_peer method will be called, which adds the PeerActor
to the list of connected peers.
Each connected peer is represented in PeerActorManager in ActivePeer the data
structure.
#![allow(unused)] fn main() { /// Contains information relevant to an active peer. struct ActivePeer { // will be renamed to `ConnectedPeer` see #5428 addr: Addr<PeerActor>, full_peer_info: FullPeerInfo, /// Number of bytes we've received from the peer. received_bytes_per_sec: u64, /// Number of bytes we've sent to the peer. sent_bytes_per_sec: u64, /// Last time requested peers. last_time_peer_requested: Instant, /// Last time we received a message from this peer. last_time_received_message: Instant, /// Time where the connection was established. connection_established_time: Instant, /// Who started connection. Inbound (other) or Outbound (us). peer_type: PeerType, } }
7.8 - Step 8 - Exchange routing table part 1 - node B
At the end of the register_peer method node B will perform a
RoutingTableSync sync. Sending the list of known edges representing a
full graph, and a list of known AnnounceAccount. Those will be
covered later, in their dedicated sections see sections (to be added).
message: PeerMessage::RoutingTableSync(SyncData::edge(new_edge)),
#![allow(unused)] fn main() { /// Contains metadata used for routing messages to particular `PeerId` or `AccountId`. pub struct RoutingTableSync { // also known as `SyncData` (#5489) /// List of known edges from `RoutingTableActor::edges_info`. pub(crate) edges: Vec<Edge>, /// List of known `account_id` to `PeerId` mappings. /// Useful for `send_message_to_account` method, to route message to particular account. pub(crate) accounts: Vec<AnnounceAccount>, } }
7.9 - Step 9 - Exchange routing table part 2 - node A
Upon receiving a RoutingTableSync message. Node A will reply with its own
RoutingTableSync message.
7.10 - Step 10 - Exchange routing table part 2 - node B
Node B will get the message from A and update its routing table.
8. Adding new edges to routing tables
This section covers the process of adding new edges, received from another node, to the routing table. It consists of several steps covered below.
8.1 Step 1
PeerManagerActor receives RoutingTableSync message containing list of new
edges to add. RoutingTableSync contains list of edges of the P2P network.
This message is then forwarded to RoutingTableActor.
8.2 Step 2
PeerManagerActor forwards those edges to RoutingTableActor inside of
the ValidateEdgeList struct.
ValidateEdgeList contains:
- list of edges to verify.
- peer who sent us the edges.
8.3 Step 3
RoutingTableActor gets the ValidateEdgeList message. Filters out edges
that have already been verified, those that are already in
RoutingTableActor::edges_info.
Then, it updates edge_verifier_requests_in_progress to mark that edge
verifications are in progress, and edges shouldn't be pruned from Routing Table
(see section (to be added)).
Then, after removing already validated edges, the modified message is forwarded
to EdgeValidatorActor.
8.4 Step 4
EdgeValidatorActor goes through the list of all edges. It checks whether all edges
are valid (their cryptographic signatures match, etc.).
If any edge is not valid, the peer will be banned.
Edges that are validated are written to a concurrent queue
ValidateEdgeList::sender. This queue is used to transfer edges from
EdgeValidatorActor back to PeerManagerActor.
8.5 Step 5
broadcast_validated_edges_trigger runs, and gets validated edges from
EdgeVerifierActor.
Every new edge will be broadcast to all connected peers.
And then, all validated edges received from EdgeVerifierActor will be sent
again to RoutingTableActor inside AddVerifiedEdges.
8.5 Step 6
When RoutingTableActor receives RoutingTableMessages::AddVerifiedEdges, the
method add_verified_edges_to_routing_table will be called. It will add edges to
RoutingTableActor::edges_info struct, and mark routing table, that it needs
a recalculation (see RoutingTableActor::needs_routing_table_recalculation).
9 Routing table computation
Routing table computation does a few things:
- For each peer
B, calculates set of peers|C_b|, such that each peer is on the shortest path toB. - Removes unreachable edges from memory and stores them to disk.
- The distance is calculated as the minimum number of nodes on the path from
given node
A, to each other node on the network. That is,Ahas a distance of0to itself. Its neighbors will have a distance of1. The neighbors of their neighbors will have a distance of2, etc.
9.1 Step 1
PeerManagerActor runs a update_routing_table_trigger every
UPDATE_ROUTING_TABLE_INTERVAL seconds.
RoutingTableMessages::RoutingTableUpdate message is sent to
RoutingTableActor to request routing table re-computation.
9.2 Step 2
RoutingTableActor receives the message, and then:
- calls
recalculate_routing_tablemethod, which computesRoutingTableActor::peer_forwarding: HashMap<PeerId, Vec<PeerId>>. For eachPeerIdon the network, gives a list of connected peers, which are on the shortest path to the destination. It marks reachable peers in thepeer_last_time_reachablestruct. - calls
prune_edgeswhich removes from memory all the edges that were not reachable for at least 1 hour, based on thepeer_last_time_reachabledata structure. Those edges are then stored to disk.
9.3 Step 3
RoutingTableActor sends a RoutingTableUpdateResponse message back to
PeerManagerActor.
PeerManagerActor keeps a local copy of edges_info, called local_edges_info
containing only edges adjacent to current node.
RoutingTableUpdateResponsecontains a list of local edges, whichPeerManagerActorshould remove.peer_forwardingwhich represents how to route messages in the P2P networkpeers_to_banrepresents a list of peers to ban for sending us edges, which failed validation inEdgeVerifierActor.
9.4 Step 4
PeerManagerActor receives RoutingTableUpdateResponse and then:
- updates local copy of
peer_forwarding, used for routing messages. - removes
local_edges_to_removefromlocal_edges_info. - bans peers, who sent us invalid edges.
10. Message transportation layers
This section describes different protocols of sending messages currently used in
Near.
10.1 Messages between Actors
Near is built on an actorframework provided by near-async. Usually each actor
runs on its own dedicated thread. Some, like PeerActor have one thread per
each instance. Only messages implementing Message, can be sent
using between threads. Each actor has its own queue; Processing of messages
happens asynchronously.
We should not leak implementation details into the spec.
Actor messages can be found by looking for structs used with the async messaging helpers (for
example types that appear in Handler<...> implementations or multi-sender definitions).
10.2 Messages sent through TCP
Near is using borsh serialization to exchange messages between nodes (See
borsh.io). We should be careful when making changes to
them. We have to maintain backward compatibility. Only messages implementing
BorshSerialize, BorshDeserialize can be sent. We also use borsh for
database storage.
10.3 Messages sent/received through chain/jsonrpc
Near runs a json REST server using the axum framework. All messages sent
and received must implement serde::Serialize and serde::Deserialize.
11. Code flow - routing a message
This is the example of the message that is being sent between nodes
RawRoutedMessage.
Each of these methods have a target - that is either the account_id or peer_id
or hash (which seems to be used only for route back...). If target is the
account - it will be converted using routing_table.account_owner to the peer.
Upon receiving the message, the PeerManagerActor
will sign it
and convert into RoutedMessage (which also have things like TTL etc.).
Then it will use the routing_table, to find the route to the target peer (add
route_back if needed) and then send the message over the network as
PeerMessage::Routed. Details about routing table computations are covered in
section 8.
When Peer receives this message (as PeerMessage::Routed), it will pass it to
PeerManager (as RoutedMessageFrom), which would then check if the message is
for the current PeerActor. (if yes, it would pass it to the client) and if
not - it would pass it along the network.
All these messages are handled by receive_client_message in Peer.
(NetworkClientMessages) - and transferred to ClientActor in
(chain/client/src/client_actor.rs)
NetworkRequests to PeerManager actor trigger the RawRoutedMessage for
messages that are meant to be sent to another peer.
lib.rs (ShardsManager) has a network_adapter - coming from the client’s
network_adapter that comes from ClientActor that comes from the start_client call
that comes from start_with_config (that creates PeerManagerActor - that is
passed as target to network_recipient).
12. Database
12.1 Storage of deleted edges
Every time a group of peers becomes unreachable at the same time; We store edges belonging to them in components. We remove all of those edges from memory, and save them to the database. If any of them were to be reachable again, we would re-add them. This is useful in case there is a network split, to recover edges if needed.
Each component is assigned a unique nonce, where first one is assigned nonce
0. Each new component gets assigned a consecutive integer.
To store components, we have the following columns in the DB.
DBCol::LastComponentNonceStorescomponent_nonce: u64, which is the last used nonce.DBCol::ComponentEdgesMapping fromcomponent_nonceto a list of edges.DBCol::PeerComponentMapping frompeer_idto the last componentnonceit belongs to.
12.2 Storage of account_id to peer_id mapping
ColAccountAnnouncements -> Stores a mapping from account_id to a tuple
(account_id, peer_id, epoch_id, signature).
Gas Cost Parameters
Gas in NEAR Protocol solves two problems.
- To avoid spam, validator nodes only perform work if a user's tokens are burned. Tokens are automatically converted to gas using the current gas price.
- To synchronize shards, they must all produce chunks following a strict schedule of 1 second execution time. Gas is used to measure how heavy the workload of a transaction is, so that the number of transactions that fit in a block can be deterministically computed by all nodes.
In other words, each transaction costs a fixed amount of gas. This gas cost determines how much a user has to pay and how much time nearcore has to execute the transaction.
What happens if nearcore executes a transaction too slowly? Chunk production for the shard gets delayed, which delays block production for the entire blockchain, increasing latency and reducing throughput for everybody. If the chunk is really late, the block producer will decide to not include the chunk at all and inserts an empty chunk. The chunk may be included in the next block.
By now, you probably wonder how we can know the time it takes to execute a transaction, given that validators use hardware of their choice. Getting these timings right is indeed a difficult problem. Or flipping the problem, assuming the timings are already known, then we must implement nearcore such that it guarantees to operate within the given time constraints. How we tackle this is the topic of this chapter.
If you want to learn more about Gas from a user perspective, Gas basic concepts, Gas advanced concepts, and the runtime fee specification are good places to dig deeper.
Hardware and Timing Assumptions
For timing to make sense at all, we must first define hardware constraints. The official hardware requirements for a validator are published on near-nodes.io/validator/hardware-validator. They may change over time but the main principle is that a moderately configured, cloud-hosted virtual machine suffices.
For our gas computation, we assume the minimum required hardware. Then we define 1015 gas to be executed in at most 1s. We commonly use 1 Tgas (= 1012 gas) in conversation, which corresponds to 1ms execution time.
Obviously, this definition means that a validator running more powerful hardware will execute the transactions faster. That is perfectly okay, as far as the protocol is concerned we just need to make sure the chunk is available in time. If it is ready in even less time, no problem.
Less obviously, this means that even a minimally configured validator is often idle. Why is that? Well, the hardware must be prepared to execute chunks that are always full. But that is rarely the case, as the gas price increases exponentially when chunks are full, which would cause traffic to go back eventually.
Furthermore, the hardware has to be ready for transactions of all types, including transactions chosen by a malicious actor selecting only the most complex transactions. Those transactions can also be unbalanced in what bottlenecks they hit. For example, a chunk can be filled with transactions that fully utilize the CPU's floating point units. Or they could be using all the available disk IO bandwidth.
Because the minimum required hardware needs to meet the timing requirements for any of those scenarios, the typical, more balanced case is usually computed faster than the gas rule states.
Transaction Gas Cost Model
A transaction is essentially just a list of actions to be executed on the same
account. For example it could be CreateAccount combined with
FunctionCall("hello_world").
The reference for available actions shows the conclusive list of possible actions. The protocol defines fixed fees for each of them. More details on actions fees follow below.
Fixed fees are an important design decision. It means that a given action will
always cost the exact same amount of gas, no matter on what hardware it
executes. But the content of the action can impact the cost, for example a
DeployContract action's cost scales with the size of the contract code.
So, to be more precise, the protocol defines fixed gas cost parameters for
each action, together with a formula to compute the gas cost for the action. All
actions today either use a single fixed gas cost or they use a base cost and a
linear scaling parameter. With one important exception, FunctionCall, which
shall be discussed further below.
There is an entire section on Parameter Definitions that explains how to find the source of truth for parameter values in the nearcore repository, how they can be referenced in code, and what steps are necessary to add a new parameter.
Let us dwell a bit more on the linear scaling factors. The fact that contract deployment cost, which includes code compilation, scales linearly limits the compiler to use only algorithms of linear complexity. Either that, or the parameters must be set to match the 1ms = 1Tgas rule at the largest possible contract size. Today, we limit ourselves to linear-time algorithms in the compiler.
Likewise, an action that has no scaling parameters must only use constant time
to execute. Taking the CreateAccount action as an example, with a cost of 0.1
Tgas, it has to execute within 0.1ms. Technically, the execution time depends
ever so slightly on the account name length. But there is a fairly low upper
limit on that length and it makes sense to absorb all the cost in the constant
base cost.
This concept of picking parameters according to algorithmic complexity is key. If you understand this, you know how to think about gas as a nearcore developer. This should be enough background to understand what the estimator does.
The runtime parameter estimator is a separate binary within the nearcore repository. It contains benchmarking-like code used to validate existing parameter values against the 1ms = 1 Tgas rule. When implementing new features, code should be added there to estimate the safe values of the new parameters. This section is for you if you are adding new features such as a new pre-compiled method or other host functions.
Next up are more details on the specific costs that occur when executing NEAR transactions, which help to understand existing parameters and how they are organized.
Action Costs
Actions are executed in two steps. First, an action is verified and inserted to
an action receipt, which is sent to the receiver of the action. The send fee
is paid for this. It is charged either in fn process_transaction(..) if the
action is part of a fresh transaction, or inside
logic.rs
through fn pay_action_base(..) if the action is generated by a function call.
The send fee is meant to cover the cost to validate an action and transmit it
over the network.
The second step is action execution. It is charged in fn apply_action(..).
The execution cost has to cover everything required to apply the action to the
blockchain's state.
These two steps are done on the same shard for local receipts. Local receipts
are defined as those where the sender account is also the receiver, abbreviated
as sir which stands for "sender is receiver".
For remote receipts, which is any receipt where the sender and receiver accounts are different, we charge a different fee since sending between shards is extra work. Notably, we charge that extra work even if the accounts are on the same shard. In terms of gas costs, each account is conceptually its own shard. This makes dynamic resharding possible without user-observable impact.
When the send step is performed, the minimum required gas to start execution of that action is known. Thus, if the receipt does not have enough gas, it can be aborted instead of forwarding it. Here we have to introduce the concept of used gas.
gas_used is different from gas_burnt. The former includes the gas that needs
to be reserved for the execution step whereas the latter only includes the gas
that has been burnt in the current chunk. The difference between the two is
sometimes also called prepaid gas, as this amount of gas is paid for during the
send step and it is available in the execution step for free.
If execution fails, the prepaid cost that has not been burned will be refunded. But this is not the reason why it must burn on the receiver shard instead of the sender shard. The reason is that we want to properly compute the gas limits on the chunk that does the execution work.
In conclusion, each action parameter is split into three costs, send_sir,
send_not_sir, and execution. Local receipts charge the first and last
parameters, remote receipts charge the second and third. They should be
estimated, defined, and charged separately. But the reality is that today almost
all actions are estimated as a whole and the parameters are split 50/50 between
send and execution cost, without discrimination on local vs remote receipts
i.e. send_sir cost is the same as send_not_sir.
The Gas Profile section goes into more details on how gas costs of a transaction are tracked in nearcore.
Dynamic Function Call Costs
Costs that occur while executing a function call on a deployed WASM app (a.k.a. smart contract) are charged only at the receiver. Thus, they have only one value to define them, in contrast to action costs.
The most fundamental dynamic gas cost is wasm_regular_op_cost. It is
multiplied by the exact number of WASM operations executed. You can read about
Gas Instrumentation
if you are curious how we count WASM ops.
Currently, all operations are charged the same, although it could be more
efficient to charge less for opcodes like i32.add compared to f64.sqrt.
The remaining dynamic costs are for work done during host function calls. Each
host function charges a base cost. Either the general wasm_base cost, or a
specific cost such as wasm_utf8_decoding_base, or sometimes both. New host
function calls should define a separate base cost and not charge wasm_base.
Additional host-side costs can be scaled per input byte, such as
wasm_sha256_byte, or costs related to moving data between host and guest, or
any other cost that is specific to the host function. Each host function must
clearly define what its costs are and how they depend on the input.
Non-gas parameters
Not all runtime parameters are directly related to gas costs. Here is a brief overview.
- Gas economics config: Defines the conversion rate when purchasing gas with NEAR tokens and how gas rewards are split.
- Storage usage config: Costs in tokens, not gas, for storing data on chain.
- Account creation config: Rules for account creation.
- Smart contract limits: Rules for WASM execution.
None of the above define any gas costs directly. But there can be interplay between those parameters and gas costs. For example, the limits on smart contracts changes the assumptions for how slow a contract compilation could be, hence it affects the deploy action costs.
Parameter Definitions
Gas parameters are a subset of runtime parameters that are defined in runtime_configs/parameters.yaml. IMPORTANT: This is not the final list of parameters, it contains the base values which can be overwritten per protocol version. For example, 53.yaml changes several parameters starting from version 53. You can see the final list of parameters in runtime_configs/parameters.snap. This file is automatically updated whenever any of the parameters changes. To see all parameter values for a specific version, check out the list of JSON snapshots generated in this directory: parameters/src/snapshots.
Using Parameters in Code
As the introduction on this page already hints at it, parameter values are versioned. In other words, they can change if the protocol version changes. A nearcore binary has to support multiple versions and choose the correct parameter value at runtime.
To make this easy, there is
RuntimeConfigStore.
It contains a sparse map from protocol versions to complete runtime
configurations (BTreeMap<ProtocolVersion, Arc<RuntimeConfig>>).
The runtime then uses store.get_config(protocol_version) to access a runtime
configuration for a specific version.
It is crucial to always use this runtime config store. Never hard-code parameter values. Never look them up in a different way.
In practice, this usually translates to a &RuntimeConfig argument for any
function that depends on parameter values. This config object implicitly defines
the protocol version. It should therefore not be cached. It should be read from
the store once per chunk and then passed down to all functions that need it.
How to Add a New Parameter
First and foremost, if you are feeling lost, open a topic in our Zulip chat (pagoda/contract-runtime). We are here to help.
Principles
Before adding anything, please review the basic principles for gas parameters.
- A parameter must correspond to a clearly defined workload.
- When the workload is scalable by a factor
Nthat depends on user input, it will likely require a base parameter and a second parameter that is multiplied byN. (Example:N= number of bytes when reading a value from storage.) - Charge gas before executing the workload.
- Parameters should be independent of specific implementation choices in nearcore.
- Ideally, contract developers can easily understand what the cost is simply by reading the name in a gas profile.
The section on Gas Profiles explains how to charge gas, please also consider that when defining a new parameter.
Necessary Code Changes
Adding the parameter in code involves several steps.
- Define the parameter by adding it to the list in
core/primitives/res/runtime_configs/parameters.yaml. - Update the Rust view of parameters by adding a variant to
enum Parameterincore/primitives-core/src/parameter.rs. In the same file, updateenum FeeParameterif you add an action cost or updateext_costs()if you add a cost inside function calls. - Update
RuntimeConfig, the configuration used to reference parameters in code. Depending on the type of parameter, you will need to updateRuntimeFeesConfig(for action costs) orExtCostsConfig(for gas costs). - Update the list used for gas profiles. This is defined by
enum Costincore/primitives-core/src/profile.rs. You need to add a variant to eitherenum ActionCostsorenum ExtCost. Please also updatefn index()that maps each profile entry to a unique position in serialized gas profiles. - The parameter should be available to use in the code section you need it in.
Now is a good time to ensure
cargo checkandcargo test --no-runpass. Most likely you have to update some testing code, such asExtCostsConfig::test(). - To merge your changes into nearcore, you will have to hide your parameter
behind a feature flag. Add the feature to the
Cargo.tomlof each crate touched in steps 3 and 4 and hide the code behind#[cfg(feature = "protocol_feature_MY_NEW_FEATURE")]. Do not hide code in step 2 so that non-nightly builds can still readparameters.yaml. Also, add your feature as a dependency onnightlyincore/primitives/Cargo.tomlto make sure it gets included when compiling for nightly. After that, checkcargo checkandcargo test --no-runwith and withoutfeatures=nightly.
What Gas Value Should the Parameter Have?
For a first draft, the exact gas value used in the parameter is not crucial. Make sure the right set of parameters exists and try to set a number that roughly makes sense. This should be enough to enable discussions on the NEP around the feasibility and usefulness of the proposed feature. If you are not sure, a good rule of thumb is 0.1 Tgas for each disk operation and at least 1 Tgas for each ms of CPU time. Then round it up generously.
The value will have to be refined later. This is usually the last step after the implementation is complete and reviewed. Have a look at the section on estimating gas parameters in the book.
Gas Profile
What if you want to understand the exact gas spending of a smart contract call? It would be very complicated to predict exactly how much gas executing a piece of WASM code will require, including all host function calls and actions. An easier approach is to just run the code on testnet and see how much gas it burns. Gas profiles allow one to dig deeper and understand the breakdown of the gas costs per parameter.
Gas profiles are not very reliable, in that they are often incomplete and the details of how they are computed can change without a protocol version bump.
Example Transaction Gas Profile
You can query the gas profile of a transaction with NEAR CLI.
NEAR_ENV=mainnet near tx-status 8vYxsqYp5Kkfe8j9LsTqZRsEupNkAs1WvgcGcUE4MUUw \
--accountId app.nearcrowd.near \
--nodeUrl https://archival-rpc.mainnet.near.org # Allows to retrieve older transactions.
Transaction app.nearcrowd.near:8vYxsqYp5Kkfe8j9LsTqZRsEupNkAs1WvgcGcUE4MUUw
{
receipts_outcome: [
{
block_hash: '2UVQKpxH6PhEqiKr6zMggqux4hwMrqqjpsbKrJG3vFXW',
id: '14bwmJF21PXY9YWGYN1jpjF3BRuyCKzgVWfhXhZBKH4u',
outcome: {
executor_id: 'app.nearcrowd.near',
gas_burnt: 5302170867180,
logs: [],
metadata: {
gas_profile: [
{
cost: 'BASE',
cost_category: 'WASM_HOST_COST',
gas_used: '15091782327'
},
{
cost: 'CONTRACT_LOADING_BASE',
cost_category: 'WASM_HOST_COST',
gas_used: '35445963'
},
{
cost: 'CONTRACT_LOADING_BYTES',
cost_category: 'WASM_HOST_COST',
gas_used: '117474381750'
},
{
cost: 'READ_CACHED_TRIE_NODE',
cost_category: 'WASM_HOST_COST',
gas_used: '615600000000'
},
# ...
# skipping entries for presentation brevity
# ...
{
cost: 'WRITE_REGISTER_BASE',
cost_category: 'WASM_HOST_COST',
gas_used: '48713882262'
},
{
cost: 'WRITE_REGISTER_BYTE',
cost_category: 'WASM_HOST_COST',
gas_used: '4797573768'
}
],
version: 2
},
receipt_ids: [ '46Qsorkr6hy36ZzWmjPkjbgG28ko1iwz1NT25gvia51G' ],
status: { SuccessValue: 'ZmFsc2U=' },
tokens_burnt: '530217086718000000000'
},
proof: [ ... ]
},
{ ... }
],
status: { SuccessValue: 'ZmFsc2U=' },
transaction: { ... },
transaction_outcome: {
block_hash: '7MgTTVi3aMG9LiGV8ezrNvoorUwQ7TwkJ4Wkbk3Fq5Uq',
id: '8vYxsqYp5Kkfe8j9LsTqZRsEupNkAs1WvgcGcUE4MUUw',
outcome: {
executor_id: 'evgeniya.near',
gas_burnt: 2428068571644,
...
tokens_burnt: '242806857164400000000'
},
}
}
The gas profile is in receipts_outcome.outcome.metadata.gas_profile. It shows
gas costs per parameter and with associated categories such as WASM_HOST_COST
or ACTION_COST. In the example, all costs are of the former category, which is
gas expended on smart contract execution. The latter is for gas spent on
actions.
To be complete, the output above should also have a gas profile entry for the function call action. But currently this is not included since gas profiles only work properly on function call receipts. Improving this is planned, see nearcore#8261.
The tx-status query returns one gas profile for each receipt. The output above
contains a single gas profile because the transaction only spawned one receipt.
If there was a chain of cross contract calls, there would be multiple profiles.
Besides receipts, also note the transaction_outcome in the output. It contains
the gas cost for converting the transaction into a receipt. To calculate the
full gas cost, add up the transaction cost with all receipt costs.
The transaction outcome currently does not have a gas profile, it only shows the total gas spent converting the transaction. Arguably, it is not necessary to provide the gas profile since the costs only depend on the list of actions. With sufficient understanding of the protocol, one could reverse-engineer the exact breakdown simply by looking at the action list. But adding the profile would still make sense to make it easier to understand.
Gas Profile Versions
Depending on the version in receipts_outcome.outcome.metadata.version, you
should expect a different format of the gas profile. Version 1 has no profile
data at all. Version 2 has a detailed profile but some parameters are conflated,
so you cannot extract the exact gas spending in some cases. Version 3 will have
the cost exactly per parameter.
Which version of the profile an RPC node returns depends on the version it had when it first processed the transaction. The profiles are stored in the database with one version and never updated. Therefore, older transactions will usually only have old profiles. However, one could replay the chain from genesis with a new nearcore client and generate the newest profile for all transactions in this way.
Note: Due to bugs, some nodes will claim they send version 1 but actually send version 2. (Did I mention that profiles are unreliable?)
How Gas Profiles are Created
The transaction runtime charges gas in various places around the code.
ActionResult keeps a summary of all costs for an action. The gas_burnt and
gas_used fields track the total gas burned and reserved for spawned receipts.
These two fields are crucial for the protocol to function correctly, as they are
used to determine when execution runs out of gas.
Additionally, ActionResult also has a profile field which keeps a detailed
breakdown of the gas spending per parameter. Profiles are not stored on chain
but RPC nodes and archival nodes keep them in their databases. This is mostly a
debug tool and has no direct impact on the correct functioning of the protocol.
Charging Gas
Generally speaking, gas is charged right before the computation that it pays for is executed. It has to be before to avoid cheap resource exhaustion attacks. Imagine the user has only 1 gas unit left, but if we start executing an expensive step, we would waste a significant duration of computation on all validators without anyone paying for it.
When charging gas for an action, the ActionResult can be updated directly. But
when charging WASM costs, it would be too slow to do a context switch each time,
Therefore, a fast gas counter exists that can be updated from within the VM.
(See
gas_counter.rs)
At the end of a function call execution, the gas counter is read by the host and
merged into the ActionResult.
Runtime Parameter Estimator
The runtime parameter estimator is a byzantine benchmarking suite. Byzantine benchmarking is not a commonly used term but I feel it describes it quite well. It measures the performance assuming that up to a third of validators and all users collude to make the system as slow as possible.
This benchmarking suite is used to check that the gas parameters defined in the protocol are correct. Correct in this context means, a chunk filled with 1 Pgas (Peta gas) will take at most 1 second to be applied. Or more generally, per 1 Tgas of execution, we spend no more than 1ms wall-clock time.
For now, nearcore timing is the only one that matters. Things will become more complicated once there are multiple client implementations. But knowing that nearcore can serve requests fast enough proves that it is possible to be at least as fast. However, we should be careful not to couple costs too tightly with the specific implementation of nearcore to allow for innovation in new clients.
The estimator code is part of the nearcore repository in the directory runtime/runtime-params-estimator.
For a practical guide on how to run the estimator, please take a look at Running the Estimator in the workflows chapter.
Code Structure
The estimator contains a binary and a library module. The main.rs contains the CLI arguments parsing code and logic to fill the test database.
The interesting code lives in
lib.rs
and its submodules. The comments at the top of that file provide a
high-level overview of how estimations work. More details on specific
estimations are available as comments on the enum variants of Cost in
costs.rs.
If you roughly understand the three files above, you already have a great
overview of the estimator.
estimator_context.rs
is another central file. A full estimation run creates a single
EstimatorContext. Each estimation will use it to spawn a new Testbed
with a fresh database that contains the same data as the setup in the
estimator context.
Most estimations fill blocks with transactions to be executed and hand them to
Testbed::measure_blocks. To allow for easy repetitions, the block is usually
filled by an instance of the
TransactionBuilder,
which can be retrieved from a testbed.
But even filling blocks with transactions becomes repetitive since many parameters are estimated similarly. utils.rs has a collection of helpful functions that let you write estimations very quickly.
Estimation Metrics
The estimation code is generally not concerned with the metric used to estimate
gas. We use let clock = GasCost::measure(); and clock.elapsed() to measure
the cost in whatever metric has been specified in the CLI argument --metric.
But when you run estimations and especially when you want to interpret the
results, you want to understand the metric used. Available metrics are time
and icount.
Starting with time, this is a simple wall-clock time measurement. At the end
of the day, this is what counts in a validator setup. But unfortunately, this
metric is very dependent on the specific hardware and what else is running on
that hardware right now. Dynamic voltage and frequency scaling (DVFS) also plays
a role here. To a certain degree, all these factors can be controlled. But it
requires full control over a system (often not the case when running on
cloud-hosted VMs) and manual labor to set it up.
The other supported metric icount is much more stable. It uses
qemu to emulate an x86 CPU. We then insert a custom
TCG plugin
(counter.c)
that counts the number of executed x86 instructions. It also intercepts system
calls and counts the number of bytes seen in sys_read, sys_write and their
variations. This gives an approximation for IO bytes, as seen on the interface
between the operating system and nearcore. To convert to gas, we use three
constants to multiply with instruction count, read bytes, and write bytes.
We run qemu inside a Docker container using the Podman runtime, to make sure the qemu and qemu
plugin versions match with system libraries. Make sure to add --containerize when running with
--metric icount.
The great thing about icount is that you can run it on different machines and
it will always return the same result. It is not 100% deterministic but very
close, so it can usually detect code changes that degrade performance in major
ways.
The problem with icount is how unrepresentative it is for real-life
performance. First, x86 instructions are not all equally complex. Second, how
many of them are executed per cycle depends on instruction level pipelining,
branch prediction, memory prefetching, and more CPU features like that which are
just not captured by an emulator like qemu. Third, the time it takes to serve
bytes in system calls depends less on the sum of all bytes and more on data
locality and how it can be cached in the OS page cache. But regardless of all
these inaccuracies, it can still be useful to compare different implementations
both measured using icount.
From Estimations to Parameter Values
To calculate the final gas parameter values, there is more to be done than just running a single command. After all, these parameters are part of the protocol specification. They cannot be changed easily. And setting them to a wrong value can cause severe system instability.
Our current strategy is to run estimations with two different metrics and do so on standardized cloud hardware. The output is then sanity checked manually by several people. Based on that, the final gas parameter value is determined. Usually, it will be the higher output of the two metrics rounded up.
The PR #8031 to set the ed25519 verification gas parameters is a good example of how such an analysis and report could look like.
More details on the process will be added to this document in due time.
Overview
This chapter describes various development processes and best practices employed at nearcore.
Rust 🦀
This short chapter collects various useful general resources about the Rust programming language. If you are already familiar with Rust, skip this chapter. Otherwise, this chapter is for you!
Getting Help
Rust community actively encourages beginners to ask questions, take advantage of that!
We have a dedicated stream for Rust questions on our Zulip: Rust 🦀.
There's a general Rust forum at https://users.rust-lang.org.
For a more interactive chat, take a look at Discord: https://discord.com/invite/rust-lang.
Reference Material
Rust is very well documented. It's possible to learn the whole language and most of the idioms by just reading the official docs. Starting points are
- The Rust Book (any resemblance to "Guide to Nearcore Development" is purely coincidental)
- Standard Library API
Alternatives are:
- Programming Rust is an alternative book that moves a bit faster.
- Rust By Example is a great resource for learning by doing.
Rust has some great tooling, which is also documented:
- Cargo, the build system. Worth at least skimming through!
- For IDE support, see IntelliJ Rust if you like JetBrains products or rust-analyzer if you use any other editor (fun fact: NEAR was one of the sponsors of rust-analyzer!).
- Rustup manages versions of Rust itself. It's unobtrusive, so feel free to skip this.
Cheat Sheet
This is a thing in its category, do check it out:
Language Mastery
- Rust for Rustaceans — the book to read after "The Book".
- Tokio docs explain asynchronous programming in Rust (async/await).
- Rust API Guidelines codify rules for idiomatic Rust APIs. Note that guidelines apply to semver surface of libraries, and most of the code in nearcore is not on the semver boundary. Still, a lot of insight there!
- Rustonomicon explains
unsafe. (any resemblance to https://nomicon.io is purely coincidental)
Selected Blog Posts
A lot of finer knowledge is hidden away in various dusty corners of Web-2.0. Here are some favorites:
- https://docs.rs/dtolnay/latest/dtolnay/macro._02__reference_types.html
- https://limpet.net/mbrubeck/2019/02/07/rust-a-unique-perspective.html
- https://smallcultfollowing.com/babysteps/blog/2018/02/01/in-rust-ordinary-vectors-are-values/
- https://smallcultfollowing.com/babysteps/blog/2016/10/02/observational-equivalence-and-unsafe-code/
- https://matklad.github.io/2021/09/05/Rust100k.html
And on the easiest topic of error handling specifically:
- http://sled.rs/errors.html
- https://kazlauskas.me/entries/errors
- http://joeduffyblog.com/2016/02/07/the-error-model/
- https://blog.burntsushi.net/rust-error-handling/
Finally, as a dessert, the first rust slide deck: http://venge.net/graydon/talks/rust-2012.pdf.
Workflows
This chapter documents various ways you can run neard during development:
running a local net, joining a test net, doing benchmarking and load testing.
Run a Node
This chapter focuses on the basics of running a node you've just built from source. It tries to explain how the thing works under the hood and pays relatively little attention to the various shortcuts we have.
Building the Node
Start with the following command:
cargo run --profile dev-release -p neard -- --help
This command builds neard and asks it to show --help. Building neard takes
a while, take a look at Fast Builds chapter to learn how to
speed it up.
Let's dissect the command:
cargo runasksCargo, the package manager/build tool, to run our application. If you don't havecargo, install it via https://rustup.rs--profile dev-releaseis our custom profile to build a somewhat optimized version of the code. The default debug profile is faster to compile, but produces a node that is too slow to participate in a real network. The--releaseprofile produces a fully optimized node, but that's very slow to compile. So--dev-releaseis a sweet spot for us! However, never use it for actual production nodes.-p neardasks to build theneardpackage. We use cargo workspaces to organize our code. Theneardpackage in the top-level/nearddirectory is the final binary that ties everything together.--tells cargo to pass the rest of the arguments through toneard.--helpinstructsneardto list available CLI arguments and subcommands.
Note: Building neard might fail with an openssl or CC error. This means
that you lack some non-rust dependencies we use (openssl and rocksdb mainly). We
currently don't have docs on how to install those, but (basically) you want to
sudo apt install (or whichever distro/package manager you use) missing bits.
Preparing Tiny Network
Typically, you want neard to connect to some network, like mainnet or
testnet. We'll get there in time, but we'll start small. For the current
chapter, we will run a network consisting of just a single node -- our own.
The first step there is creating the required configuration. Run the init
command to create config files:
$ cargo run --profile dev-release -p neard -- init
INFO neard: version="trunk" build="1.1.0-3091-ga8964d200-modified" latest_protocol=57
INFO near: Using key ed25519:B41GMfqE2jWHVwrPLbD7YmjZxxeQE9WA9Ua2jffP5dVQ for test.near
INFO near: Using key ed25519:34d4aFJEmc2A96UXMa9kQCF8g2EfzZG9gCkBAPcsVZaz for node
INFO near: Generated node key, validator key, genesis file in ~/.near
As the log output says, we are just generating some things in ~/.near.
Let's take a look:
$ ls ~/.near
config.json
genesis.json
node_key.json
validator_key.json
The most interesting file here is perhaps genesis.json -- it specifies the
initial state of our blockchain. There are a bunch of hugely important fields
there, which we'll ignore here. The part we'll look at is the .records, which
contains the actual initial data:
$ cat ~/.near/genesis.json | jq '.records'
[
{
"Account": {
"account_id": "test.near",
"account": {
"amount": "1000000000000000000000000000000000",
"locked": "50000000000000000000000000000000",
"code_hash": "11111111111111111111111111111111",
"storage_usage": 0,
"version": "V1"
}
}
},
{
"AccessKey": {
"account_id": "test.near",
"public_key": "ed25519:B41GMfqE2jWHVwrPLbD7YmjZxxeQE9WA9Ua2jffP5dVQ",
"access_key": {
"nonce": 0,
"permission": "FullAccess"
}
}
},
{
"Account": {
"account_id": "near",
"account": {
"amount": "1000000000000000000000000000000000",
"locked": "0",
"code_hash": "11111111111111111111111111111111",
"storage_usage": 0,
"version": "V1"
}
}
},
{
"AccessKey": {
"account_id": "near",
"public_key": "ed25519:546XB2oHhj7PzUKHiH9Xve3Ze5q1JiW2WTh6abXFED3c",
"access_key": {
"nonce": 0,
"permission": "FullAccess"
}
}
}
(I am using the jq utility here)
We see that we have two accounts here, and we also see their public keys (but not the private ones).
One of these accounts is a validator:
$ cat ~/.near/genesis.json | jq '.validators'
[
{
"account_id": "test.near",
"public_key": "ed25519:B41GMfqE2jWHVwrPLbD7YmjZxxeQE9WA9Ua2jffP5dVQ",
"amount": "50000000000000000000000000000000"
}
]
Now, if we
cat ~/.near/validator_key.json
we'll see
{
"account_id": "test.near",
"public_key": "ed25519:B41GMfqE2jWHVwrPLbD7YmjZxxeQE9WA9Ua2jffP5dVQ",
"secret_key": "ed25519:3x2dUQgBoEqNvKwPjfDE8zDVJgM8ysqb641PYHV28mGPu61WWv332p8keMDKHUEdf7GVBm4f6z4D1XRgBxnGPd7L"
}
That is, we have a secret key for the sole validator in our network, how convenient.
To recap, neard init without arguments creates a config for a new network
that starts with a single validator, for which we have the keys.
You might be wondering what ~/.near/node_key.json is. That's not too
important, but, in our network, there's no 1-1 correspondence between machines
participating in the peer-to-peer network and accounts on the blockchain. So the
node_key specifies the keypair we'll use when signing network packets. These
packets internally will contain messages signed with the validator's key, and
these internal messages will drive the evolution of the blockchain state.
Finally, ~/.near/config.json contains various configs for the node itself.
These are configs that don't affect the rules guiding the evolution of the
blockchain state, but rather things like timeouts, database settings and
such.
The only field we'll look at is boot_nodes:
$ cat ~/.near/config.json | jq '.network.boot_nodes'
""
It's empty! The boot_nodes specify IPs of the initial nodes our node will
try to connect to on startup. As we are looking into running a single-node
network, we want to leave it empty. But, if you would like to connect to
mainnet, you'd have to set this to some nodes from the mainnet you already know.
You'd also have to ensure that you use the same genesis as the mainnet though
-- if the node tries to connect to a network with a different genesis, it
is rejected.
Running the Network
Finally,
$ cargo run --profile dev-release -p neard -- run
INFO neard: version="trunk" build="1.1.0-3091-ga8964d200-modified" latest_protocol=57
INFO near: Creating a new RocksDB database path=/home/matklad/.near/data
INFO db: Created a new RocksDB instance. num_instances=1
INFO stats: # 0 4xecSHqTKx2q8JNQNapVEi5jxzewjxAnVFhMd4v5LqNh Validator | 1 validator 0 peers ⬇ 0 B/s ⬆ 0 B/s NaN bps 0 gas/s CPU: 0%, Mem: 50.8 MB
INFO near_chain::doomslug: ready to produce block @ 1, has enough approvals for 59.907µs, has enough chunks
INFO near_chain::doomslug: ready to produce block @ 2, has enough approvals for 40.732µs, has enough chunks
INFO near_chain::doomslug: ready to produce block @ 3, has enough approvals for 65.341µs, has enough chunks
INFO near_chain::doomslug: ready to produce block @ 4, has enough approvals for 51.916µs, has enough chunks
INFO near_chain::doomslug: ready to produce block @ 5, has enough approvals for 37.155µs, has enough chunks
...
🎉 it's alive!
So, what's going on here?
Our node is running a single-node network. As the network only has a single
validator, and the node has the keys for the validator, the node can produce
blocks by itself. Note the increasing @ 1, @ 2, ... numbers. That
means that our network grows.
Let's stop the node with ^C and look around
INFO near_chain::doomslug: ready to produce block @ 42, has enough approvals for 56.759µs, has enough chunks
^C WARN neard: SIGINT, stopping... this may take a few minutes.
INFO neard: Waiting for RocksDB to gracefully shutdown
INFO db: Waiting for remaining RocksDB instances to shut down num_instances=1
INFO db: All RocksDB instances shut down
$
The main change now is that we have a ~/.near/data directory which holds the
state of the network in various rocksdb tables:
$ ls ~/.near/data
000004.log
CURRENT
IDENTITY
LOCK
LOG
MANIFEST-000005
OPTIONS-000107
OPTIONS-000109
It doesn't matter what those are, "rocksdb stuff" is a fine level of understanding here. The important bit here is that the node remembers the state of the network, so, when we restart it, it continues from around the last block:
$ cargo run --profile dev-release -p neard -- run
INFO neard: version="trunk" build="1.1.0-3091-ga8964d200-modified" latest_protocol=57
INFO db: Created a new RocksDB instance. num_instances=1
INFO db: Dropped a RocksDB instance. num_instances=0
INFO near: Opening an existing RocksDB database path=/home/matklad/.near/data
INFO db: Created a new RocksDB instance. num_instances=1
INFO stats: # 5 Cfba39eH7cyNfKn9GoKTyRg8YrhoY1nQxQs66tLBYwRH Validator | 1 validator 0 peers ⬇ 0 B/s ⬆ 0 B/s NaN bps 0 gas/s CPU: 0%, Mem: 49.4 MB
INFO near_chain::doomslug: not ready to produce block @ 43, need to wait 366.58789ms, has enough approvals for 78.776µs
INFO near_chain::doomslug: not ready to produce block @ 43, need to wait 265.547148ms, has enough approvals for 101.119518ms
INFO near_chain::doomslug: not ready to produce block @ 43, need to wait 164.509153ms, has enough approvals for 202.157513ms
INFO near_chain::doomslug: not ready to produce block @ 43, need to wait 63.176926ms, has enough approvals for 303.48974ms
INFO near_chain::doomslug: ready to produce block @ 43, has enough approvals for 404.41498ms, does not have enough chunks
INFO near_chain::doomslug: ready to produce block @ 44, has enough approvals for 50.07µs, has enough chunks
INFO near_chain::doomslug: ready to produce block @ 45, has enough approvals for 45.093µs, has enough chunks
Interacting With the Node
Ok, now our node is running, let's poke it! The node exposes a JSON RPC interface which can be used to interact with the node itself (to, e.g., do a health check) or with the blockchain (to query information about the blockchain state or to submit a transaction).
$ http get http://localhost:3030/status
HTTP/1.1 200 OK
access-control-allow-credentials: true
access-control-expose-headers: accept-encoding, accept, connection, host, user-agent
content-length: 1010
content-type: application/json
date: Tue, 15 Nov 2022 13:58:13 GMT
vary: Origin, Access-Control-Request-Method, Access-Control-Request-Headers
{
"chain_id": "test-chain-rR8Ct",
"latest_protocol_version": 57,
"node_key": "ed25519:71QRP9qKcYRUYXTLNnrmRc1NZSdBaBo9nKZ88DK5USNf",
"node_public_key": "ed25519:5A5QHyLayA9zksJZGBzveTgBRecpsVS4ohuxujMAFLLa",
"protocol_version": 57,
"rpc_addr": "0.0.0.0:3030",
"sync_info": {
"earliest_block_hash": "6gJLCnThQENYFbnFQeqQvFvRsTS5w87bf3xf8WN1CMUX",
"earliest_block_height": 0,
"earliest_block_time": "2022-11-15T13:45:53.062613669Z",
"epoch_id": "6gJLCnThQENYFbnFQeqQvFvRsTS5w87bf3xf8WN1CMUX",
"epoch_start_height": 501,
"latest_block_hash": "9JC9o3rZrDLubNxVr91qMYvaDiumzwtQybj1ZZR9dhbK",
"latest_block_height": 952,
"latest_block_time": "2022-11-15T13:58:13.185721125Z",
"latest_state_root": "9kEYQtWczrdzKCCuFzPDX3Vtar1pFPXMdLU5HJyF8Ght",
"syncing": false
},
"uptime_sec": 570,
"validator_account_id": "test.near",
"validator_public_key": "ed25519:71QRP9qKcYRUYXTLNnrmRc1NZSdBaBo9nKZ88DK5USNf",
"validators": [
{
"account_id": "test.near",
"is_slashed": false
}
],
"version": {
"build": "1.1.0-3091-ga8964d200-modified",
"rustc_version": "1.65.0",
"version": "trunk"
}
}
(I am using HTTPie here)
Note how "latest_block_height": 952 corresponds to @ 952 we see in the logs.
Let's query the blockchain state:
$ http post http://localhost:3030/ method=query jsonrpc=2.0 id=1 \
params:='{"request_type": "view_account", "finality": "final", "account_id": "test.near"}'
λ http post http://localhost:3030/ method=query jsonrpc=2.0 id=1 \
params:='{"request_type": "view_account", "finality": "final", "account_id": "test.near"}'
HTTP/1.1 200 OK
access-control-allow-credentials: true
access-control-expose-headers: content-length, accept, connection, user-agent, accept-encoding, content-type, host
content-length: 294
content-type: application/json
date: Tue, 15 Nov 2022 14:04:54 GMT
vary: Origin, Access-Control-Request-Method, Access-Control-Request-Headers
{
"id": "1",
"jsonrpc": "2.0",
"result": {
"amount": "1000000000000000000000000000000000",
"block_hash": "Hn4v5CpfWf141AJi166gdDK3e3khCxgfeDJ9dSXGpAVi",
"block_height": 1611,
"code_hash": "11111111111111111111111111111111",
"locked": "50003138579594550524246699058859",
"storage_paid_at": 0,
"storage_usage": 182
}
}
Note how we use an HTTP post method when we interact with the blockchain RPC.
The full set of RPC endpoints is documented at
https://docs.near.org/api/rpc/introduction
Sending Transactions
Transactions are submitted via RPC as well. Submitting a transaction manually
with http is going to be cumbersome though — transactions are borsh encoded
to bytes, then signed, then encoded in base64 for JSON.
So we will use the official NEAR CLI utility.
Install it via npm:
$ npm install -g near-cli@3.4.2
$ near -h
Usage: near <command> [options]
Commands:
near create-account <accountId> create a new developer account
....
Note that, although you install near-cli, the name of the utility is near.
As a first step, let's redo the view_account call we did with raw httpie
with near-cli:
$ NEAR_ENV=local near state test.near
Loaded master account test.near key from ~/.near/validator_key.json with public key = ed25519:71QRP9qKcYRUYXTLNnrmRc1NZSdBaBo9nKZ88DK5USNf
Account test.near
{
amount: '1000000000000000000000000000000000',
block_hash: 'ESGN7H1kVLp566CTQ9zkBocooUFWNMhjKwqHg4uCh2Sg',
block_height: 2110,
code_hash: '11111111111111111111111111111111',
locked: '50005124762657986708532525400812',
storage_paid_at: 0,
storage_usage: 182,
formattedAmount: '1,000,000,000'
}
NEAR_ENV=local tells near-cli to use our local network, rather than the
mainnet.
Now, let's create a couple of accounts and send tokes between them:
$ NEAR_ENV=local near create-account alice.test.near --masterAccount test.near
NOTE: In most cases, when connected to network "local", masterAccount will end in ".node0"
Loaded master account test.near key from /home/matklad/.near/validator_key.json with public key = ed25519:71QRP9qKcYRUYXTLNnrmRc1NZSdBaBo9nKZ88DK5USNf
Saving key to 'undefined/local/alice.test.near.json'
Account alice.test.near for network "local" was created.
$ NEAR_ENV=local near create-account bob.test.near --masterAccount test.near
NOTE: In most cases, when connected to network "local", masterAccount will end in ".node0"
Loaded master account test.near key from /home/matklad/.near/validator_key.json with public key = ed25519:71QRP9qKcYRUYXTLNnrmRc1NZSdBaBo9nKZ88DK5USNf
Saving key to 'undefined/local/bob.test.near.json'
Account bob.test.near for network "local" was created.
$ NEAR_ENV=local near send alice.test.near bob.test.near 10
Sending 10 NEAR to bob.test.near from alice.test.near
Loaded master account test.near key from /home/matklad/.near/validator_key.json with public key = ed25519:71QRP9qKcYRUYXTLNnrmRc1NZSdBaBo9nKZ88DK5USNf
Transaction Id BBPndo6gR4X8pzoDK7UQfoUXp5J8WDxkf8Sq75tK5FFT
To see the transaction in the transaction explorer, please open this url in your browser
http://localhost:9001/transactions/BBPndo6gR4X8pzoDK7UQfoUXp5J8WDxkf8Sq75tK5FFT
Note: You can export the variable NEAR_ENV in your shell if you are planning
to do multiple commands to avoid repetition:
export NEAR_ENV=local
NEAR CLI printouts are not always the most useful or accurate, but this seems to work.
Note that near automatically creates keypairs and stores them at
.near-credentials:
$ ls ~/.near-credentials/local
alice.test.near.json
bob.test.near.json
To verify that this did work, and that near-cli didn't cheat us, let's
query the state of accounts manually:
$ http post http://localhost:3030/ method=query jsonrpc=2.0 id=1 \
params:='{"request_type": "view_account", "finality": "final", "account_id": "alice.test.near"}' \
| jq '.result.amount'
"89999955363487500000000000"
14:30:52|~
λ http post http://localhost:3030/ method=query jsonrpc=2.0 id=1 \
params:='{"request_type": "view_account", "finality": "final", "account_id": "bob.test.near"}' \
| jq '.result.amount'
"110000000000000000000000000"
Indeed, some amount of tokes was transferred from alice to bob, and then
some amount of tokens was deducted to account for transaction fees.
Recap
Great! So we've learned how to run our very own single-node NEAR network using a binary we've built from source. The steps are:
- Create configs with
cargo run --profile dev-release -p neard -- init - Run the node with
cargo run --profile dev-release -p neard -- run - Poke the node with
httpieor - Install
near-clivianpm install -g near-cli@3.4.2 - Submit transactions via
NEAR_ENV=local near create-account ...
In the next chapter, we'll learn how to deploy a simple WASM contract.
Deploy a Contract
In this chapter, we'll learn how to build, deploy, and call a minimal smart contract on our local node.
Preparing Ground
Let's start with creating a fresh local network with an account to which we'll deploy a contract. You might want to re-read how to run a node to understand what's going on here:
cargo run --profile dev-release -p neard -- init
cargo run --profile dev-release -p neard -- run
NEAR_ENV=local near create-account alice.test.near --masterAccount test.near
As a sanity check, querying the state of alice.test.near account should work:
$ NEAR_ENV=local near state alice.test.near
Loaded master account test.near key from /home/matklad/.near/validator_key.json with public key = ed25519:7tU4NtFozPWLotcfhbT9KfBbR3TJHPfKJeCri8Me6jU7
Account alice.test.near
{
amount: '100000000000000000000000000',
block_hash: 'EEMiLrk4ZiRzjNJXGdhWPJfKXey667YBnSRoJZicFGy9',
block_height: 24,
code_hash: '11111111111111111111111111111111',
locked: '0',
storage_paid_at: 0,
storage_usage: 182,
formattedAmount: '100'
}
Minimal Contract
NEAR contracts are WebAssembly blobs of bytes. To
create a contract, a contract developer typically uses an SDK for some
high-level programming language, such as JavaScript, which takes care of
producing the right .wasm.
In this guide, we are interested in how things work under the hood, so we'll do everything manually, and implement a contract in Rust without any help from SDKs.
As we are looking for something simple, let's create a contract with a single
"method", hello, which returns a "hello world" string. To "define a method",
a wasm module should export a function. To "return a value", the contract needs
to interact with the environment to say "hey, this is the value I am returning".
Such "interactions" are carried through host functions, which are quite a bit
like syscalls in traditional operating systems.
The set of host functions that the contract can import is defined in
imports.rs.
In this particular case, we need the value_return function:
value_return<[value_len: u64, value_ptr: u64] -> []>
This means that the value_return function takes a pointer to a slice of bytes,
the length of the slice, and returns nothing. If the contract calls this function,
the slice would be considered a result of the function.
To recap, we want to produce a .wasm file with roughly the following content:
(module
(import "env" "value_return" (func $value_return (param i64 i64)))
(func (export "hello") ... ))
Cargo Boilerplate
Armed with this knowledge, we can write Rust code to produce the required WASM. Before we start doing that, some amount of setup code is required.
Let's start with creating a new crate:
cargo new hello-near --lib
To compile to wasm, we also need to add a relevant rustup toolchain:
rustup toolchain add wasm32-unknown-unknown
Then, we need to tell Cargo that the final artifact we want to get is a WebAssembly module.
This requires the following cryptic spell in Cargo.toml:
# hello-near/Cargo.toml
[lib]
crate-type = ["cdylib"]
Here, we ask Cargo to build a "C dynamic library". When compiling for wasm,
that'll give us a .wasm module. This part is a bit confusing, sorry about
that :(
Next, as we are aiming for minimalism here, we need to disable optional bits
of the Rust runtime. Namely, we want to make our crate no_std (this means
that we are not going to use the Rust standard library), set panic=abort
as our panic strategy and define a panic handler to abort execution.
# hello-near/Cargo.toml
[package]
name = "hello-near"
version = "0.1.0"
edition = "2024"
[lib]
crate-type = ["cdylib"]
[profile.release]
panic = "abort"
#![allow(unused)] fn main() { // hello-near/src/lib.rs #![no_std] #[panic_handler] fn panic_handler(_info: &core::panic::PanicInfo) -> ! { core::arch::wasm32::unreachable() } }
At this point, we should be able to compile our code to wasm, and it should be fairly small. Let's do that:
$ cargo b -r --target wasm32-unknown-unknown
Compiling hello-near v0.1.0 (~/hello-near)
Finished release [optimized] target(s) in 0.24s
$ ls target/wasm32-unknown-unknown/release/hello_near.wasm
.rwxr-xr-x 106 matklad 15 Nov 15:34 target/wasm32-unknown-unknown/release/hello_near.wasm
106 bytes is pretty small! Let's see what's inside. For that, we'll use
the wasm-tools suite of CLI utilities.
$ cargo install wasm-tools
λ wasm-tools print target/wasm32-unknown-unknown/release/hello_near.wasm
(module
(memory (;0;) 16)
(global $__stack_pointer (;0;) (mut i32) i32.const 1048576)
(global (;1;) i32 i32.const 1048576)
(global (;2;) i32 i32.const 1048576)
(export "memory" (memory 0))
(export "__data_end" (global 1))
(export "__heap_base" (global 2))
)
Rust Contract
Finally, let's implement an actual contract. We'll need an extern "C" block to
declare the value_return import, and a #[unsafe(no_mangle)] extern "C" function to
declare the hello export:
#![allow(unused)] fn main() { // hello-near/src/lib.rs #![no_std] unsafe extern "C" { fn value_return(len: u64, ptr: u64); } #[unsafe(no_mangle)] pub extern "C" fn hello() { let msg = "hello world"; unsafe { value_return(msg.len() as u64, msg.as_ptr() as u64) } } #[panic_handler] fn panic_handler(_info: &core::panic::PanicInfo) -> ! { core::arch::wasm32::unreachable() } }
After building the contract, the output wasm shows us that it's roughly what we want:
$ cargo b -r --target wasm32-unknown-unknown
Compiling hello-near v0.1.0 (/home/matklad/hello-near)
Finished release [optimized] target(s) in 0.05s
$ wasm-tools print target/wasm32-unknown-unknown/release/hello_near.wasm
(module
(type (;0;) (func (param i64 i64)))
(type (;1;) (func))
(import "env" "value_return" (; <- Here's our import. ;)
(func $value_return (;0;) (type 0)))
(func $hello (;1;) (type 1)
i64.const 11
i32.const 1048576
i64.extend_i32_u
call $value_return
)
(memory (;0;) 17)
(global $__stack_pointer (;0;) (mut i32) i32.const 1048576)
(global (;1;) i32 i32.const 1048587)
(global (;2;) i32 i32.const 1048592)
(export "memory" (memory 0))
(export "hello" (func $hello)) (; <- And export! ;)
(export "__data_end" (global 1))
(export "__heap_base" (global 2))
(data $.rodata (;0;) (i32.const 1048576) "hello world")
)
Deploying the Contract
Now that we have the WASM, let's deploy it!
$ NEAR_ENV=local near deploy alice.test.near \
./target/wasm32-unknown-unknown/release/hello_near.wasm
Loaded master account test.near key from /home/matklad/.near/validator_key.json with public key = ed25519:ChLD1qYic3G9qKyzgFG3PifrJs49CDYeERGsG58yaSoL
Starting deployment. Account id: alice.test.near, node: http://127.0.0.1:3030, helper: http://localhost:3000, file: ./target/wasm32-unknown-unknown/release/hello_near.wasm
Transaction Id GDbTLUGeVaddhcdrQScVauYvgGXxSssEPGUSUVAhMWw8
To see the transaction in the transaction explorer, please open this url in your browser
http://localhost:9001/transactions/GDbTLUGeVaddhcdrQScVauYvgGXxSssEPGUSUVAhMWw8
Done deploying to alice.test.near
And, finally, let's call our contract:
$ NEAR_ENV=local near call alice.test.near hello --accountId alice.test.near
Scheduling a call: alice.test.near.hello()
Loaded master account test.near key from /home/matklad/.near/validator_key.json with public key = ed25519:ChLD1qYic3G9qKyzgFG3PifrJs49CDYeERGsG58yaSoL
Doing account.functionCall()
Transaction Id 9WMwmTf6pnFMtj1KBqjJtkKvdFXS4kt3DHnYRnbFpJ9e
To see the transaction in the transaction explorer, please open this url in your browser
http://localhost:9001/transactions/9WMwmTf6pnFMtj1KBqjJtkKvdFXS4kt3DHnYRnbFpJ9e
'hello world'
Note that we pass alice.test.near twice: the first time to specify which contract
we are calling, the second time to determine who calls the contract. That is,
the second account is the one that spends tokens. In the following example bob
spends NEAR to call the contact deployed to the alice account:
$ NEAR_ENV=local near call alice.test.near hello --accountId bob.test.near
Scheduling a call: alice.test.near.hello()
Loaded master account test.near key from /home/matklad/.near/validator_key.json with public key = ed25519:ChLD1qYic3G9qKyzgFG3PifrJs49CDYeERGsG58yaSoL
Doing account.functionCall()
Transaction Id 4vQKtP6zmcR4Xaebw8NLF6L5YS96gt5mCxc5BUqUcC41
To see the transaction in the transaction explorer, please open this url in your browser
http://localhost:9001/transactions/4vQKtP6zmcR4Xaebw8NLF6L5YS96gt5mCxc5BUqUcC41
'hello world'
Running the Estimator
This workflow describes how to run the gas estimator byzantine-benchmark suite. To learn about its background and purpose, refer to Runtime Parameter Estimator in the architecture chapter.
Type this in your console to quickly run estimations on a couple of action costs.
cargo run -p runtime-params-estimator --features required -- \
--accounts-num 20000 --additional-accounts-num 20000 \
--iters 3 --warmup-iters 1 --metric time \
--costs=ActionReceiptCreation,ActionTransfer,ActionCreateAccount,ActionFunctionCallBase
You should get an output like this.
[elapsed 00:00:17 remaining 00:00:00] Writing into storage ████████████████████ 20000/20000
ActionReceiptCreation 4_499_673_502_000 gas [ 4.499674ms] (computed in 7.22s)
ActionTransfer 410_122_090_000 gas [ 410.122µs] (computed in 4.71s)
ActionCreateAccount 237_495_890_000 gas [ 237.496µs] (computed in 4.64s)
ActionFunctionCallBase 770_989_128_914 gas [ 770.989µs] (computed in 4.65s)
Finished in 40.11s, output saved to:
/home/you/near/nearcore/costs-2022-11-11T11:11:11Z-e40863c9b.txt
This shows how much gas a parameter should cost to satisfy the 1ms = 1Tgas rule. It also shows how much time that corresponds to and how long it took to compute each of the estimations.
Note that the above does not produce very accurate results and it can have high variance as well. It runs an unoptimized binary, the state is small, and the metric used is wall-clock time which is always prone to variance in hardware and can be affected by other processes currently running on your system.
Once your estimation code is ready, it is better to run it with a larger state and an optimized binary.
cargo run --release -p runtime-params-estimator --features required -- \
--accounts-num 20000 --additional-accounts-num 2000000 \
--iters 3 --warmup-iters 1 --metric time \
--costs=ActionReceiptCreation,ActionTransfer,ActionCreateAccount,ActionFunctionCallBase
You might also want to run a hardware-agnostic estimation using the following
command. It uses podman and qemu under the hood, so it will be quite a bit
slower. You will need to install podman to run this command.
cargo run --release -p runtime-params-estimator --features required -- \
--accounts-num 20000 --additional-accounts-num 2000000 \
--iters 3 --warmup-iters 1 --metric icount --containerize \
--costs=ActionReceiptCreation,ActionTransfer,ActionCreateAccount,ActionFunctionCallBase
Note how the output looks a bit different now. The i, r and w values show
instruction count, read IO bytes, and write IO bytes respectively. The IO byte
count is known to be inaccurate.
+ /host/nearcore/runtime/runtime-params-estimator/emu-cost/counter_plugin/qemu-x86_64 -plugin file=/host/nearcore/runtime/runtime-params-estimator/emu-cost/counter_plugin/libcounter.so -cpu Haswell-v4 /host/nearcore/target/release/runtime-params-estimator --home /.near --accounts-num 20000 --iters 3 --warmup-iters 1 --metric icount --costs=ActionReceiptCreation,ActionTransfer,ActionCreateAccount,ActionFunctionCallBase --skip-build-test-contract --additional-accounts-num 0 --in-memory-db
ActionReceiptCreation 214_581_685_500 gas [ 1716653.48i 0.00r 0.00w] (computed in 6.11s)
ActionTransfer 21_528_212_916 gas [ 172225.70i 0.00r 0.00w] (computed in 4.71s)
ActionCreateAccount 26_608_336_250 gas [ 212866.69i 0.00r 0.00w] (computed in 4.67s)
ActionFunctionCallBase 12_193_364_898 gas [ 97546.92i 0.00r 0.00w] (computed in 2.39s)
Finished in 17.92s, output saved to:
/host/nearcore/costs-2022-11-01T16:27:36Z-e40863c9b.txt
The difference between the metrics is discussed in the Estimation Metrics chapter.
You should now be all set up for running estimations on your local machine. Also,
check cargo run -p runtime-params-estimator --features required -- --help for
the list of available options.
Running near localnet on 2 machines
Quick instructions on how to run a localnet on 2 separate machines.
Setup
- Machine1: "pc" - 192.168.0.1
- Machine2: "laptop" - 192.168.0.2
Run on both machines (make sure that they are using the same version of the code):
cargo build -p neard
Then on machine1 run the command below, which will generate the configurations:
./target/debug/neard --home ~/.near/localnet_multi localnet --shards 3 --v 2
This command has generated configuration for 3 shards and 2 validators (in directories ~/.near/localnet_multi/node0 and ~/.near/localnet_multi/node1).
Now - copy the contents of node1 directory to the machine2
rsync -r ~/.near/localnet_multi/node1 192.168.0.2:~/.near/localnet_multi/node1
Now open the config.json file on both machines (node0/config.json on machine1 and node1/config.json on machine2) and:
- for rpc->addr and network->addr:
- Change the address from 127.0.0.1 to 0.0.0.0 (this means that the port will be accessible from other computers)
- Remember the port numbers (they are generated randomly).
- Also write down the node0's node_key (it is probably: "ed25519:7PGseFbWxvYVgZ89K1uTJKYoKetWs7BJtbyXDzfbAcqX")
Running
On machine1:
./target/debug/neard --home ~/.near/localnet_multi/node0 run
On machine2:
./target/debug/neard --home ~/.near/localnet_multi/node1 run --boot-nodes ed25519:7PGseFbWxvYVgZ89K1uTJKYoKetWs7BJtbyXDzfbAcqX@192.168.0.1:37665
The boot node address should be the IP of the machine1 + the network addr port from the node0/config.json
And if everything goes well, the nodes should communicate and start producing blocks.
Troubleshooting
The debug mode is enabled by default, so you should be able to see what's going on by going to http://machine1:RPC_ADDR_PORT/debug
If node keeps saying "waiting for peers"
See if you can see the machine1's debug page from machine2. (if not - there might be a firewall blocking the connection).
Make sure that you set the right ports (it should use node0's NETWORK port) and that you set the ip add there to 0.0.0.0
Resetting the state
Simply stop both nodes, and remove the data subdirectory (~/.near/localnet_multi/node0/data and ~/.near/localnet_multi/node1/data).
Then after restart, the nodes will start the blockchain from scratch.
IO tracing
When should I use IO traces?
IO traces can be used to identify slow receipts and to understand why they are slow. Or to detect general inefficiencies in how we use the DB.
The results give you counts of DB requests and some useful statistics such as trie node cache hits. It will NOT give you time measurements, use Grafana to observe those.
The main use cases in the past were to estimate the performance of new storage features (prefetcher, flat state) and to find out why specific contracts produce slow receipts.
Setup
When compiling neard (or the parameter estimator) with feature=io_trace it
instruments the binary code with fine-grained database operations tracking.
Aside: We don't enable it by default because we are afraid the overhead could be too much, since we store some information for very hot paths such as trie node cache hits. Although we haven't properly evaluated if it really is a performance problem.
This allows using the --record-io-trace=/path/to/output.io_trace CLI flag on
neard. Run it in combination with the subcommands neard run, neard view-state, or runtime-params-estimator and it will record an IO trace. Make
sure to provide the flag to neard itself, however, not to the subcommands.
(See examples below)
# Example command for normal node
# (Careful! This will quickly fill your disk if you let it run.)
cargo build --release -p neard --features=io_trace
target/release/neard \
--record-io-trace=/mnt/disks/some_disk_with_enough_space/my.io_trace \
run
# Example command for state viewer, applying a range of chunks in shard 0
cargo build --release -p neard --features=io_trace
target/release/neard \
--record-io-trace=75220100-75220101.s0.io_trace \
view-state apply-range --start-index 75220100 --end-index 75220101 \
--shard-id 0 sequential
# Example command for params estimator
cargo run --release -p runtime-params-estimator --features=required,io_trace \
-- --accounts-num 200000 --additional-accounts-num 200000 \
--iters 3 --warmup-iters 1 --metric time \
--record-io-trace=tmp.io \
--costs ActionReceiptCreation
IO trace content
Once you have collected an IO trace, you can inspect its content manually, or use existing tools to extract statistics. Let's start with the manual approach.
Simple example trace: Estimator
An estimator trace typically starts something like this:
commit
SET DbVersion "'VERSION'" size=2
commit
SET DbVersion "'KIND'" size=3
apply num_transactions=0 shard_cache_miss=7
GET State "AAAAAAAAAAB3I0MYevRcExi1ql5PSQX+fuObsPH30yswS7ytGPCgyw==" size=46
GET State "AAAAAAAAAACGDsmYvNoBGZnc8PzDKoF4F2Dvw3N6XoAlRrg8ezA8FA==" size=107
GET State "AAAAAAAAAAB3I0MYevRcExi1ql5PSQX+fuObsPH30yswS7ytGPCgyw==" size=46
GET State "AAAAAAAAAACGDsmYvNoBGZnc8PzDKoF4F2Dvw3N6XoAlRrg8ezA8FA==" size=107
GET State "AAAAAAAAAAB3I0MYevRcExi1ql5PSQX+fuObsPH30yswS7ytGPCgyw==" size=46
GET State "AAAAAAAAAACGDsmYvNoBGZnc8PzDKoF4F2Dvw3N6XoAlRrg8ezA8FA==" size=107
GET State "AAAAAAAAAAB3I0MYevRcExi1ql5PSQX+fuObsPH30yswS7ytGPCgyw==" size=46
...
Depending on the source, traces look a bit different at the start. But you should always see some setup at the beginning and per-chunk workload later on.
Indentation is used to display the call hierarchy. The commit keyword shows
when a commit starts, and all SET and UPDATE_RC commands that follow with
one level deeper indentation belong to that same database transaction commit.
Later, you see a group that starts with an apply header. It groups all IO
requests that were performed for a call to fn apply
that applies transactions and receipts of a chunk to the previous state root.
In the example, you see a list of GET requests that belong to that apply,
each with the DB key used and the size of the value read. Further, you can read
in the trace that this specific chunk had 0 transactions and that it
cache-missed all 7 of the DB requests it performed to apply this empty chunk.
Example trace: Full mainnet node
Next let's look at an excerpt of an IO trace from a real node on mainnet.
...
GET State "AQAAAAMAAACm9DRx/dU8UFEfbumiRhDjbPjcyhE6CB1rv+8fnu81bw==" size=9
GET State "AQAAAAAAAACLFgzRCUR3inMDpkApdLxFTSxRvprJ51eMvh3WbJWe0A==" size=203
GET State "AQAAAAIAAACXlEo0t345S6PHsvX1BLaGw6NFDXYzeE+tlY2srjKv8w==" size=299
apply_transactions shard_id=3
process_state_update
apply num_transactions=3 shard_cache_hit=207
process_transaction tx_hash=C4itKVLP5gBoAPsEXyEbi67Gg5dvQVugdMjrWBBLprzB shard_cache_hit=57
GET FlatState "AGxlb25hcmRvX2RheS12aW5jaGlrLm5lYXI=" size=36
GET FlatState "Amxlb25hcmRvX2RheS12aW5jaGlrLm5lYXICANLByB1merOzxcGB1HI9/L60QvONzOE6ovF3hjYUbhA8" size=36
process_transaction tx_hash=GRSXC4QCBJHN4hmJiATAbFGt9g5PiksQDNNRaSk666WX shard_cache_miss=3 prefetch_pending=3 shard_cache_hit=35
GET FlatState "AnJlbGF5LmF1cm9yYQIA5iq407bcLgisCKxQQi47TByaFNe9FOgQg5y2gpU4lEM=" size=36
process_transaction tx_hash=6bDPeat12pGqA3KEyyg4tJ35kBtRCuFQ7HtCpWoxr8qx shard_cache_miss=2 prefetch_pending=1 shard_cache_hit=21 prefetch_hit=1
GET FlatState "AnJlbGF5LmF1cm9yYQIAyKT1vEHVesMEvbp2ICA33x6zxfmBJiLzHey0ZxauO1k=" size=36
process_receipt receipt_id=GRB3skohuShBvdGAoEoR3SdJJw7MwCxxscJHKLdPoYUC predecessor=1663adeba849fb7c26195678e1c5378278e5caa6325d4672246821d8e61bb160 receiver=token.sweat id=GRB3skohuShBvdGAoEoR3SdJJw7MwCxxscJHKLdPoYUC shard_cache_too_large=1 shard_cache_miss=1 shard_cache_hit=38
GET FlatState "AXRva2VuLnN3ZWF0" size=36
GET State "AQAAAAMAAADVYp4vtlIbDoVhji22CZOEaxVWVTJKASq3iMvpNEQVDQ==" size=206835
input
register_len
read_register
storage_read READ key='STATE' size=70 tn_db_reads=20 tn_mem_reads=0 shard_cache_hit=21
register_len
read_register
attached_deposit
predecessor_account_id
register_len
read_register
sha256
read_register
storage_read READ key=dAAxagYMOEb01+56sl9vOM0yHbZRPSaYSL3zBXIfCOi7ow== size=16 tn_db_reads=10 tn_mem_reads=19 shard_cache_hit=11
GET FlatState "CXRva2VuLnN3ZWF0LHQAMWoGDDhG9NfuerJfbzjNMh22UT0mmEi98wVyHwjou6M=" size=36
register_len
read_register
sha256
read_register
storage_write WRITE key=dAAxagYMOEb01+56sl9vOM0yHbZRPSaYSL3zBXIfCOi7ow== size=16 tn_db_reads=0 tn_mem_reads=30
...
Maybe that's a bit much. Let's break it down into pieces.
It start with a few DB get requests that are outside of applying a chunk. It's quite common that we have these kinds of constant overhead requests that are independent of what's inside a chunk. If we see too many such requests, we should take a close look to see if we are wasting performance.
GET State "AQAAAAMAAACm9DRx/dU8UFEfbumiRhDjbPjcyhE6CB1rv+8fnu81bw==" size=9
GET State "AQAAAAAAAACLFgzRCUR3inMDpkApdLxFTSxRvprJ51eMvh3WbJWe0A==" size=203
GET State "AQAAAAIAAACXlEo0t345S6PHsvX1BLaGw6NFDXYzeE+tlY2srjKv8w==" size=299
Next let's look at apply_transactions but limit the depth of items to 3
levels.
apply_transactions shard_id=3
process_state_update
apply num_transactions=3 shard_cache_hit=207
process_transaction tx_hash=C4itKVLP5gBoAPsEXyEbi67Gg5dvQVugdMjrWBBLprzB shard_cache_hit=57
process_transaction tx_hash=GRSXC4QCBJHN4hmJiATAbFGt9g5PiksQDNNRaSk666WX shard_cache_miss=3 prefetch_pending=3 shard_cache_hit=35
process_transaction tx_hash=6bDPeat12pGqA3KEyyg4tJ35kBtRCuFQ7HtCpWoxr8qx shard_cache_miss=2 prefetch_pending=1 shard_cache_hit=21 prefetch_hit=1
process_receipt receipt_id=GRB3skohuShBvdGAoEoR3SdJJw7MwCxxscJHKLdPoYUC predecessor=1663adeba849fb7c26195678e1c5378278e5caa6325d4672246821d8e61bb160 receiver=token.sweat id=GRB3skohuShBvdGAoEoR3SdJJw7MwCxxscJHKLdPoYUC shard_cache_too_large=1 shard_cache_miss=1 shard_cache_hit=38
Here you can see that before we even get to apply, we go through
apply_transactions and process_state_update. The excerpt does not show it
but there are DB requests listed further below that belong to these levels but
not to apply.
Inside apply, we see 3 transactions being converted to receipts as part of
this chunk, and one already existing action receipt getting processed.
Cache hit statistics for each level are also displayed. For example, the first transaction has 57 read requests and all of them hit in the shard cache. For the second transaction, we miss the cache 3 times but the values were already in the process of being prefetched. This would be account data which we fetch in parallel for all transactions in the chunk.
Finally, there are several process_receipt groups, although the excerpt was
cut to display only one. Here we see the receiving account
(receiver=token.sweat) and the receipt ID to potentially look it up on an
explorer, or dig deeper using state viewer commands.
Again, cache hit statistics are included. Here you can see one value missed the cache because it was too large. Usually that's a contract code. We do not include it in the shard cache because it would take up too much space.
Zooming in a bit further, let's look at the DB request at the start of the receipt.
GET FlatState "AXRva2VuLnN3ZWF0" size=36
GET State "AQAAAAMAAADVYp4vtlIbDoVhji22CZOEaxVWVTJKASq3iMvpNEQVDQ==" size=206835
input
register_len
read_register
storage_read READ key='STATE' size=70 tn_db_reads=20 tn_mem_reads=0 shard_cache_hit=21
register_len
read_register
FlatState "AXRva2VuLnN3ZWF0" reads the ValueRef of the contract code, which
is 36 bytes in its serialized format. Then, the ValueRef is dereferenced to
read the actual code, which happens to be 206kB in size. This happens in the
State column because at the time of writing, we still read the actual values
from the trie, not from flat state.
What follows are host function calls performed by the SDK. It uses input to
check the function call arguments and copies it from a register into WASM
memory.
Then the SDK reads the serialized contract state from the hardcoded key
"STATE". Note that we charge 20 tn_db_reads for it, since we missed the
accounting cache, but we hit everything in the shard cache. Thus, there are no DB
requests. If there were DB requests for this tn_db_reads, you would see them
listed.
The returned 70 bytes are again copied into WASM memory. Knowing the SDK code a little bit, we can guess that the data is then deserialized into the struct used by the contract for its root state. That's not visible on the trace though, as this happens completely inside the WASM VM.
Next we start executing the actual contract code, which again calls a bunch of host functions. Apparently the code starts by reading the attached deposit and the predecessor account id, presumably to perform some checks.
The sha256 call here is used to shorten implicit account ids.
(Link to code for comparison).
Afterwards, a value with 16 bytes (a u128) is fetched from the trie state.
To serve this, it required reading 30 trie nodes, 19 of them were cached in the
accounting cache and were not charged the full gas cost. And the remaining 11
missed the accounting cache but they hit the shard cache. Nothing needed to be
fetched from DB because the Sweatcoin specific prefetcher has already loaded
everything into the shard cache.
Note: We see trie node requests despite flat state being used. This is because the trace was collected with a binary that performed a read on both the trie and flat state to do some correctness checks.
attached_deposit
predecessor_account_id
register_len
read_register
sha256
read_register
storage_read READ key=dAAxagYMOEb01+56sl9vOM0yHbZRPSaYSL3zBXIfCOi7ow== size=16 tn_db_reads=10 tn_mem_reads=19 shard_cache_hit=11
GET FlatState "CXRva2VuLnN3ZWF0LHQAMWoGDDhG9NfuerJfbzjNMh22UT0mmEi98wVyHwjou6M=" size=36
So that is how to read these traces and dig deep. But maybe you want aggregated statistics instead? Then please continue reading.
Evaluating an IO trace
When you collect an IO trace over an hour of mainnet traffic, it can quickly be above 1GB in uncompressed size. You might be able to sample a few receipts and eyeball them to get a feeling for what's going on. But you can't understand the whole trace without additional tooling.
The parameter estimator command replay can help with that. (See also this
readme)
Run the following command to see an overview of available commands.
# will print the help page for the IO trace replay command
cargo run --profile dev-release -p runtime-params-estimator -- \
replay --help
All commands aggregate the information of a trace. Either globally, per chunk, or per receipt. For example, below is the output that gives a list of RocksDB columns that were accessed and how many times, aggregated by chunk.
cargo run --profile dev-release -p runtime-params-estimator -- \
replay ./path/to/my.io_trace chunk-db-stats
apply_transactions shard_id=3 block=DajBgxTgV8NewTJBsR5sTgPhVZqaEv9xGAKVnCiMiDxV
GET 12 FlatState 4 State
apply_transactions shard_id=0 block=DajBgxTgV8NewTJBsR5sTgPhVZqaEv9xGAKVnCiMiDxV
GET 14 FlatState 8 State
apply_transactions shard_id=2 block=HTptJFZKGfmeWs7y229df6WjMQ3FGfhiqsmXnbL2tpz8
GET 2 FlatState
apply_transactions shard_id=3 block=HTptJFZKGfmeWs7y229df6WjMQ3FGfhiqsmXnbL2tpz8
GET 6 FlatState 2 State
apply_transactions shard_id=1 block=HTptJFZKGfmeWs7y229df6WjMQ3FGfhiqsmXnbL2tpz8
GET 50 FlatState 5 State
...
apply_transactions shard_id=3 block=AUcauGxisMqNmZu5Ln7LLu8Li31H1sYD7wgd7AP6nQZR
GET 17 FlatState 3 State
top-level:
GET 8854 Block 981 BlockHeader 16556 BlockHeight 59155 BlockInfo 2 BlockMerkleTree 330009 BlockMisc 1 BlockOrdinal 31924 BlockPerHeight 863 BlockRefCount 1609 BlocksToCatchup 1557 ChallengedBlocks 4 ChunkExtra 5135 ChunkHashesByHeight 128788 Chunks 35 EpochInfo 1 EpochStart 98361 FlatState 1150 HeaderHashesByHeight 8113 InvalidChunks 263 NextBlockHashes 22 OutgoingReceipts 131114 PartialChunks 1116 ProcessedBlockHeights 968698 State
SET 865 BlockHeight 1026 BlockMerkleTree 12428 BlockMisc 1636 BlockOrdinal 865 BlockPerHeight 865 BlockRefCount 3460 ChunkExtra 3446 ChunkHashesByHeight 339142 FlatState 3460 FlatStateDeltas 3460 FlatStateMisc 865 HeaderHashesByHeight 3460 IncomingReceipts 865 NextBlockHashes 3442 OutcomeIds 3442 OutgoingReceipts 863 ProcessedBlockHeights 340093 StateChanges 3460 TrieChanges
The output contains one apply_transactions for each chunk, with the block hash
and the shard id. Then it prints one line for each DB operations observed
(GET,SET,...) together with a list of columns and an OP count.
See the top-level output at the end? These are all the DB requests that could
not be assigned to specific chunks. The way we currently count write operations
(SET, UPDATE_RC) they are never assigned to a specific chunk and instead only
show up in the top-level list. Clearly, there is some room for improvement here.
So far we simply haven't worried about RocksDB write performance so the tooling
to debug write performance is naturally lacking.
Profiling neard
Sampling performance profiling
It is a common task to need to look where neard is spending time. Outside of instrumentation
we've also been successfully using sampling profilers to gain an intuition over how the code works
and where it spends time. It is a very quick way to get some baseline understanding of the
performance characteristics, but due to its probabilistic nature it is also not particularly precise
when it comes to small details.
Linux's perf has been a tool of choice in most cases, although tools like Intel VTune could be
used too. In order to use either, first prepare your system:
sudo sysctl kernel.perf_event_paranoid=0 kernel.kptr_restrict=0
Beware that this gives access to certain kernel state and environment to the unprivileged user. Once investigation is over either set these properties back to the more restricted settings or, better yet, reboot.
Definitely do not run untrusted code after running these commands.
Then collect a profile as such:
$ perf record -ecpu-clock -esyscalls:sys_enter_{"epoll_*wait*","futex_wait*",futex_wake,io_uring_enter,nanosleep,pause,"*poll","*select*",sched_yield,"wait*"} -esched:sched_switch -F1000 -g --call-graph dwarf,65528 [YOUR_COMMAND_HERE]
# or attach to a running process:
$ perf record -ecpu-clock -esyscalls:sys_enter_{"epoll_*wait*","futex_wait*",futex_wake,io_uring_enter,nanosleep,pause,"*poll","*select*",sched_yield,"wait*"} -esched:sched_switch -F1000 -g --call-graph dwarf,65528 -p [NEARD_PID]
# possibly with a pre-specified collection duration
$ timeout 15 perf record -ecpu-clock -esyscalls:sys_enter_{"epoll_*wait*","futex_wait*",futex_wake,io_uring_enter,nanosleep,pause,"*poll","*select*",sched_yield,"wait*"} -esched:sched_switch -F1000 -g --call-graph dwarf,65528 -p [NEARD_PID]
This command will use the CPU time clock to determine when to trigger a sampling process and will
do such sampling roughly 1000 times (the -F argument) every CPU second. It will also sample a
selection of syscall entries as well as scheduler switches. Readers are encouraged to adjust the
events they record – ones in the command above are a good baseline only.
Once terminated, this command will produce a profile file in the current working directory.
Although you can inspect the profile already with perf report, we've had much better experience
with using Firefox Profiler as the viewer. Although Firefox
Profiler supports perf and many other different data formats, for perf in particular a
conversion step is necessary. For ideal results with Firefox Profiler,
samply is recommended, as it produces a much better
rendering than the perf script approach previously recommended by this and Firefox Profiler
documentation alike.
$ cargo install samply
$ samply import -P 3333 perf.data
This will open a local server with a profiler UI. If profiling on a cloud machine, use a SSH proxy to access this interface (you can start another ssh session):
$ gcloud compute ssh --ssh-flag='-L 3333:localhost:3333' [OTHER_ARGS...]
# open localhost:3333 in your browser
From there you can inspect the profile locally and upload it to profiler.firefox.com for sharing
with others.
Low overhead stack frame collection
The command above uses -g --call-graph dwarf,65528 parameter to instruct perf to collect
stack trace for each sample using DWARF unwinding metadata. This will work no matter how neard is
built, but is expensive and not super precise (e.g. it has trouble with JIT code.) If you have an
ability to build a profiling-tuned build of neard, you can use higher quality stack frame
collection.
cargo build --release --config .cargo/config.profiling.toml -p neard
Then, replace the --call-graph dwarf with --call-graph fp:
perf record -ecpu-clock -esyscalls:sys_enter_{"epoll_*wait*","futex_wait*",futex_wake,io_uring_enter,nanosleep,pause,"*poll","*select*",sched_yield,"wait*"} -esched:sched_switch -F1000 -g --call-graph fp,65528 [YOUR_COMMAND_HERE]
Headless samply use
Samply instructions above require manual interaction with browsers, which makes automation difficult. If you'd like to just get files for, headless operation is also possible. Do note that the results produced this way lose some information that is otherwise made available with the instructions above. Most notably – kernel symbols may be lost.
$ samply import --cswitch-markers --unstable-presymbolicate -s -n perf.data
$ ls profile.json*
These files can later be viewed with
$ samply load
Lost samples
In some cases perf may complain about lost samples. This can happen more often when profiling
neard with a large number threads. To mitigate sample loss, reduce the sampling rate, use low
overhead stack frame collection and/or record traces to a
fast storage device (possibly /tmp mounted on tmpfs.)
Profiling with hardware counters
As mentioned earlier, sampling profiler is probabilistic and the data it produces is only really suitable for a broad overview. Any attempt to analyze the performance of the code at the microarchitectural level (which you might want to do if investigating how to speed up a small but frequently invoked function) will be severely hampered by the low quality of data.
For a long time now, CPUs are able to expose information about how it operates on the code at a very fine grained level: how many cycles have passed, how many instructions have been processed, how many branches have been taken, how many predictions were incorrect, how many cycles were spent waiting of a memory accesses and many more. These allow a much better look at how the code behaves.
Until recently, use of these detailed counters was still sampling based -- the CPU would produce
some information at a certain cadence of these counters (e.g. every 1000 instructions or cycles)
which still shares a fair number of the same downsides as sampling cpu-clock. In order to address
this downside, recent CPUs from both Intel and AMD have implemented a list of recent branches taken
-- Last Branch Record or LBR. This is available on reasonably
recent Intel architectures as well as starting with Zen 4 on the side of AMD. With LBRs profilers
are able to gather information about the cycle counts between each branch, giving an accurate and
precise evaluation of the performance at a basic block
or function call level.
It all sounds really nice, so why are we not using these mechanisms all the time? That's because
GCP VMs don't allow access to these counters! In order to access them the code has to be run on
your own hardware, or a VM instance that provides direct access to the hardware, such as the (quite
expensive) c3-highcpu-192-metal type.
Once everything is set up, though, the following command can gather some interesting information for you.
perf record -e cycles:u -b -g --call-graph fp,65528 YOUR_COMMAND_HERE
Analyzing this data is, unfortunately, not as easy as chucking it away to Firefox Profiler. I'm not
aware of any other ways to inspect the data other than using perf report:
perf report -g --branch-history
perf report -g --branch-stack
You may also be able to gather some interesting results if you use --call-graph lbr and the
relevant reporting options as well.
Memory usage profiling
neard is a pretty memory-intensive application with many allocations occurring constantly.
Although Rust makes it pretty hard to introduce memory problems, it is still possible to leak
memory or to inadvertently retain too much of it.
Unfortunately, “just” throwing a random profiler at neard does not work for many reasons. Valgrind
for example is introducing enough slowdown to significantly alter the behavior of the run, not to
mention that to run it successfully and without crashing it will be necessary to comment out
neard’s use of jemalloc for yet another substantial slowdown.
So far the only tool that worked out well out of the box was
bytehound. Using it is quite straightforward, but needs
Linux, and ability to execute privileged commands.
First, checkout and build the profiler (you will need to have nodejs yarn thing available as
well):
git clone git@github.com:koute/bytehound.git
cargo build --release -p bytehound-preload
cargo build --release -p bytehound-cli
You will also need a build of your neard, once you have that, give it some ambient capabilities
necessary for profiling:
sudo sysctl kernel.perf_event_paranoid=0
sudo setcap 'CAP_SYS_ADMIN+ep' /path/to/neard
sudo setcap 'CAP_SYS_ADMIN+ep' /path/to/libbytehound.so
And finally run the program with the profiler enabled (in this case neard run command is used):
/lib64/ld-linux-x86-64.so.2 --preload /path/to/libbytehound.so /path/to/neard run
Viewing the profile
Do note that you will need about twice the amount of RAM as the size of the input file in order to load it successfully.
Once enough profiling data has been gathered, terminate the program. Use the bytehound CLI tool
to operate on the profile. I recommend bytehound server over directly converting to e.g. heaptrack
format using other subcommands as each invocation will read and parse the profile data from
scratch. This process can take quite some time. server parses the inputs once and makes
conversions and other introspection available as interactive steps.
You can use server interface to inspect the profile in one of the few ways, download a flamegraph
or a heaptrack file. Heaptrack in particular provides some interesting additional visualizations
and has an ability to show memory use over time from different allocation sources.
I personally found it a bit troublesome to figure out how to open the heaptrack file from the GUI.
However, heaptrack myexportedfile worked perfectly. I recommend opening the file exactly this way.
Troubleshooting
No output file
- Set a higher profiler logging level. Verify that the profiler gets loaded at all. If you're not seeing any log messages, then something about your working environment is preventing the loader from including the profiler library.
- Try specifying an exact output file with e.g. environment variables that the profiler reads.
Crashes
If the profiled neard crashes in your tests, there are a couple of things you can try to get past
it. First, make sure your binary has the necessary ambient capabilities (setcap command above
needs to be executed every time binary is replaced!)
Another thing to try is disabling jemalloc. Comment out this code in neard/src/main.rs:
#![allow(unused)] fn main() { #[global_allocator] static ALLOC: tikv_jemallocator::Jemalloc = tikv_jemallocator::Jemalloc; }
The other thing you can try is different profilers, different versions of the profilers or different options made available (in particular disabling the shadow stack in bytehound), although I don't have specific recommendations here.
We don't know what exactly it is about neard that leads to it crashing under the profiler as easily as it does. I have seen valgrind reporting that we have libraries that are deallocating with a wrong size class, so that might be the reason? Do definitely look into this if you have time.
What to profile?
This section provides some ideas on programs you could consider profiling if you are not sure where to start.
First and foremost you could go shotgun and profile a full running neard node that's operating on
mainnet or testnet traffic. There are a couple ways to set up such a node: search for
my-own-mainnet or a forknet based
tooling.
From there either attach to a running neard run process or stop the running one and start a new
instance under the profiler.
This approach will give you a good overview of the entire system, but at the same time the information might be so dense, it might be difficult to derive any signal from the noise. There are alternatives that isolate certain components of the runtime:
Runtime::apply
Profiling just the Runtime::apply is going to include the work done by transaction runtime and
the contract runtime only. A smart use of the tools already present in the neard binary can
achieve that today.
First, make sure all deltas in flat storage are applied and written:
neard view-state --read-write apply-range --storage flat sequential
You will need to do this for all shards you're interested in profiling. Then pick a block or a range of blocks you want to re-apply and set the flat head to the specified height:
neard flat-storage move-flat-head back --blocks 17
Finally the following commands will apply the block or blocks from the height in various different ways. Experiment with the different modes and flags to find the best fit for your task. Don't forget to run these commands under the profiler :)
# Apply blocks from current flat head to the highest known block height in sequence
# using the memtrie storage (note that after this you will need to move the flat head again)
neard view-state --read-write apply-range --storage memtrie sequential
# Same but with flat storage
neard view-state --read-write apply-range --storage flat sequential
# Repeatedly apply a single block at the flat head using the memtrie storage.
# Will not modify the storage on the disk.
neard view-state apply-range --storage memtrie benchmark
# Same but with flat storage
neard view-state apply-range --storage flat benchmark
# Same but with recorded storage
neard view-state apply-range --storage recorded benchmark
Note that all of these commands operate on all shards at the same time. You can specify
--shard-id argument to pick just one shard to operate with.
Benchmarking neard
At the moment there are 3 major benchmarking tools in use:
- Native token transactions using the RPC node
- Native token transactions directly injecting transaction to the pool
apply-rangebenchmarks
The first two can be run either single node or multi-node setup.
Native token transactions
Using the RPC Node to generate the load
This one includes all major components of the network including the RPC layer. Which makes it most representative for measuring the realistic throughput of the network while on the same time introduces some noise and makes it difficult to reason about the performance of the specific components.
One needs to compile the benchmarks/synth-bm, create the link to the neard executable and run the tasks from the justfile.
The details are available on the dedicated page.
Direct transaction injection
This section closely follows (duplicates) the dedicated readme.md in benchmarks/transaction-generator.
In case of questions you may want to consult that as well.
This benchmark bypasses the RPC layer and injects the transactions using direct calls to the ingress handling actor.
It is representative of the performance of the neard excluding the RPC layer.
The single-node setup of this benchmark is a part of the CI.
Run the benchmark
- compile the
neardwith thetx_generatorfeature
cargo build --release --features tx_generator
- create a link to the release binary of neard in the
benchmarks/transactions-generator
cd benchmarks/transactions-generator && ln -s ../../release/neard ./
- run the thing
just do_it 20000
The last command will init a single-node network, apply customizations to the config, create the accounts and run the benchmark for 3m.
All of it.
For a more fine-grained control feel free to dive into the justfile for the commands executing the intermediate steps.
Tweaking the load generation parameters
The load generation parameters are expected as a part of the neard config.json.
The node name is "tx_generator" and is optional.
In case the node is missing the error message is printed out and the neard continues running as usually.
The node currently consists of the path to "schedule" and "controller" sections
{
"tx_generator": {
"accounts_path": "{{near_accounts_path}}",
"schedule": [
{ "tps": 1000, "duration_s": 60 },
{ "tps": 2000, "duration_s": 60 }
],
"controller": {
"target_block_production_time_s": 1.4,
"bps_filter_window_length": 64,
"gain_proportional": 20,
"gain_integral": 0.0,
"gain_derivative": 0.0
}
}
}
The "schedule" section is required and defines the load applying schedule.
After the schedule completes the neard will exit in case "controller" is not defined, or else will run the control loop defined by the parameters indefinitely.
The last scheduled TPS is than used as a starting point and the loop adjusts TPS to keep the target block production time at a desired value.
Note that the resulting production time currently tends to be slightly under the target value.
What you should see
- observe the load reported in the logs
...
2025-02-12T16:42:37.351118Z INFO stats: # 1584 6nxZon12xBTmARmUm3ngtgaA2K7V9dX1J13EtPZ2kEhe Validator | 1 validator 0 peers ⬇ 0 B/s ⬆ 0 B/s 1.60 bps 131 Tgas/s CPU: 70%, Mem: 2.98 GB
...
2025-02-18T13:04:29.790195Z INFO transaction-generator: total="Stats { pool_accepted: 158247, pool_rejected: 237, included_in_chunks: 155338, failed:0 }"
2025-02-18T13:04:29.790208Z INFO transaction-generator: diff="Stats { pool_accepted: 6049, pool_rejected: 0, included_in_chunks: 6439, failed: 0 }, rate=6036"
...
- see the number of processed transactions (
near_transaction_processed_successfully_total) or transactions included to the chunks (near_chunk_transactions_total) in the metrics
$ curl http://localhost:3030/metrics -s | rg "near_transaction_processed_successfully_total (\\d+)"
near_transaction_processed_successfully_total 852883
The first one is prone to double-counting the transactions but may better reflect the performance of the underlying runtime.
[!CAUTION] When the un-limiting settings are applied to the network config the network is prone to failing in non-obvious ways. To notice the degradation one can monitor for missing chunks and block production times for example. When the latter starts to grow that means the network no longer sustains the load although the reported mean rate of transaction processing may remain at a high level (reflecting the performance the runtime subsystem).
Apply-range benchmark
This measures the performance of the runtime sub-system in isolation applying the block or blocks in multiple configurable ways.
The detailed description of it is provided in the profiling section, Runtime::apply subsection.
To evaluate the number of rate of processing the transactions one may query the stats as described above.
Multi-Node setup
For benchmarking multi-node sharded networks, there is a comprehensive toolset in the sharded-bm. This framework allows testing various network configurations with different numbers of shards, validators and traffic profiles.
The sharded benchmark framework supports both localnet testing on a single machine and forknet deployments. Forknet is particularly useful as it allows creating a network running on multiple VMs, providing real-world conditions for performance testing.
To run sharded benchmarks on a forknet, you'll need to:
- Set up the required infrastructure using terraform
- Configure environment variables for the benchmark
- Initialize and start the network
- Create test accounts and run the benchmark
Alternatively one may use the infra-ops workflow.
For detailed instructions and configuration options, refer to the README.
Benchmarking synthetic workloads
Benchmarking a synthetic workload starts a new network with empty state. Then state is created and afterwards transactions involving that state are generated. For example, the native token transfer workload creates n accounts with NEAR balance and then generates transactions to transfer the native token between accounts.
This approach has the following benefits:
- Relatively simple and quick setup, as there is no state from real work networks involved.
- Fine grained control over traffic intensity.
- Enabling the comparison of
neardperformance at different points in time or with different features. - Might expose performance bottlenecks.
The main drawbacks of synthetic benchmarks are:
- Drawing conclusions is limited as real world traffic is not homogeneous.
- Calibrating traffic generation parameters can be cumbersome.
The tooling for synthetic benchmarks is available in benchmarks/synth-bm.
Workflows
The tooling's justfile contains recipes for the most relevant workflows.
Benchmark native token transfers
A typical workflow benchmarking the native token transfers using the above justfile would be something along the:
- set up the network
rm -rf .near && just init_localnet
# Modify the configuration (see the "Un-limit configuration" section)
[t1]$ just run_localnet
[t1]$ just create_sub_accounts
- run the benchmark
# set the desired tx rate (`--interval-duration-micros`) and the total volume (`--num-transfers`) in the justfile
[t2]$ just benchmark_native_transfers
This benchmark generates a native token transfer workload involving the accounts provided in --user-data-dir. Transactions are generated by iterating through these accounts and sending native tokens to a randomly chosen receiver from the same set of accounts. To view all options, run:
cargo run --release -- benchmark-native-transfers --help
For the native transfer benchmark transactions are sent with wait_until: None, meaning the responses the near_synth_bm tool receives are basically just an ACK by the RPC confirming it received the transaction.
Thus the numbers reported by the tool as if in
[2025-01-27T14:05:12Z INFO near_synth_bm::native_transfer] Sent 200000 txs in 6.50 seconds
[2025-01-27T14:05:12Z INFO near_synth_bm::rpc] Received 200000 tx responses in 6.49 seconds
are not directly indicative of the runtime performance and transaction outcomes.
The number of transactions successfully processed may be obtained by querying the near_transaction_processed_successfully_total metric, e.g. with: http://localhost:3030/metrics | grep transaction_processed.
Automatic calculation of transactions per second (TPS) when RPC requests are sent with wait_until: NONE is coming up shortly.
Benchmark calls to the sign method of an MPC contract
Assumes the accounts that send the transactions invoking sign have been created as described above. Transactions can be sent to a RPC of a network on which an instance of the mpc/chain-signatures is deployed.
Transactions are sent to the RPC with wait_until: EXECUTED_OPTIMISTIC as the throughput for sign is at a level at which neither the network nor the RPC are expected to be a bottleneck.
All options of the command can be shown with:
cargo run -- benchmark-mpc-sign --help
Auxiliary steps
Network setup and neard configuration
Details of bringing up and configuring a network are out of scope for this document. Instead we just give a brief overview of the setup regularly used to benchmark TPS of common workloads in a single-node with a single-shard setup.
Build neard
Choose the git commit and cargo features corresponding to what you want to benchmark. Most likely you will want a --release build to measure TPS. Place the corresponding neard binary in the justfile's directory or set the NEARD_PATH environment variable to point to it.
Create sub accounts
Creating the state for synthetic benchmarks usually starts with creating accounts. We create sub accounts for the account specified by --signer-key-path. This avoids dealing with the registrar, which would be required for creating top level accounts. To view all options, run:
cargo run --release -- create-sub-accounts --help
Initialize the network
./neard --home .near init --chain-id localnet
Enable memtrie
The configuration generated by the above command does not enable memtrie. However, most benchmarks should run against a node with memtrie enabled, which can be achieved by setting the following in .near/config.json:
"load_mem_tries_for_tracked_shards": true
Un-limit configuration
Following these steps so far creates a config that will throttle throughput due to various factors related to state witness size, gas/compute limits, and congestion control. In case you want to benchmark a node that fully utilizes its hardware, you can do the following modifications to effectively run with unlimited configuration:
# Modifications in .near/genesis.json
"chain_id": "benchmarknet"
"gas_limit": 20000000000000000 # increase default by x20
# Modifications in .near/config.json
"view_client_threads": 8 # increase default by x2
"load_mem_tries_for_tracked_shards": true # enable memtrie
"produce_chunk_add_transactions_time_limit": {
"secs": 0,
"nanos": 800000000 # increase default by x4
}
Note that as nearcore evolves, these steps and BENCHMARKNET adjustments might need to be updated to achieve the effect of un-limiting configuration.
Modifications of genesis.json need to be applied before initializing the network with just init_localnet. Otherwise just run_localnet will fail. If you ran the node with default config and want to switch to unlimited config, the required steps are:
# Remove .near as you will need to initialize localnet again.
$ rm -rf .near
$ just init_localnet
# Modify the configuration
$ just run_localnet
Common parameters
The following parameters are common to multiple tasks:
rpc-url
The RPC endpoint to which transactions are sent.
Synthetic benchmarking may create thousands of transactions per second, which can hit network limitations if the RPC is located on a separate machine. In particular sending transactions to nodes running on GCP requires care as it can cause temporary IP address bans. For that scenario it is recommended to run a separate traffic generation vm located in the same GCP zone as the RPC node and send transactions to its internal IP.
interval-duration-micros
Controls the rate at which transactions are sent. Assuming your hardware is able to send a request at every interval tick, the number of transactions sent per second equals 1_000_000 / interval-duration-micros. The rate might be slowed down if channel-buffer-size becomes a bottleneck.
channel-buffer-size
Before an RPC request is sent, the tooling awaits capacity on a buffered channel. Thereby the number of outstanding RPC requests is limited by channel-buffer-size. This can slow down the rate at which transactions are sent in case the node is congested. To disable that behavior, set channel-buffer-size to a large value, e.g. the total number of transactions to be sent.
Benchmarking chunk application on the native transfers workload
This doc shows how to:
- Run a single-node localnet with native transfer workload
- Use the
view-statecommand to benchmark applying one of the chunks created during the workload
Running the workload creates ~realistic chunks and state and then we can benchmark applying one of the chunks using this.
Running the initial workload
Clone nearcore and build neard with the tx_generator feature
Note: Building
neardwith--profile dev-releaseinstead of--releasetakes less time and the binary is almost as fast as the release one.
Note: If you plan to gather
perfprofiles, build with--config .cargo/config.profiling.toml(see profiling docs)
git clone https://github.com/near/nearcore
cd nearcore
cargo build -p neard --release --features tx_generator
Build synth-bm
cd benchmarks/synth-bm
cargo build --release
Go to transaction-generator
cd ../transactions-generator/
Create a link to neard
ln -s ../../target/release/neard
Set TPS to 4000
There are two files with the load schedule: tx-generator-settings.json and tx-generator-settings.json.in.
Transaction generator reads data from the tx-generator-settings.json file, not the one with .in suffix. The .in file is used only to store the default values for transaction generator. If tx-generator-settings.json doesn't exist, it's created based on tx-generator-settings.json.in during the first run.
This way you can modify tx-generator-settings.json locally without merge conflicts.
Create tx-generator-settings.json:
cp tx-generator-settings.json.in tx-generator-settings.json
Set tps = 4000 in tx-generator-settings.json. Example jq command (might not work in the future if the file structure changes):
jq '.tx_generator.schedule[0].tps = 4000' tx-generator-settings.json | sponge tx-generator-settings.json
Run the native transfers workload (Ignore "Error: tx generator idle: no schedule provided", this is normal during just create-accounts)
just do-it
This will create a benchmarks/transactions-generator/.near directory with node state, create accounts and run the workload.
Creating accounts takes a few minutes, be patient.
Sometimes running the workload fails because the database LOCK hasn't been freed in time. If that happens run just run-localnet to retry.
Re-running the workload
To re-run the workload run just run-localnet. It's not necessary to do just do-it, which would recreate the state from scratch.
To change TPS edit the tx-generator-settings.json file (without .in !) and run just enable-tx
Preparing state for chunk application benchmark
(Taken from profiling docs)
First, make sure all deltas in flat storage are applied and written:
./neard --home .near view-state --read-write apply-range --storage flat sequential
Then move flat head back 32 blocks to a height that had chunks with high load
./neard --home .near flat-storage move-flat-head back --blocks 32
Benchmarking chunk application
Run these commands to benchmark chunk application at the height to which the flat head was moved.
./neard --home .near view-state apply-range --storage flat benchmark
or
./neard --home .near view-state apply-range --storage memtrie benchmark
or
./neard --home .near view-state apply-range --storage recorded benchmark
Working with OpenTelemetry Traces
neard is instrumented in a few different ways. From the code perspective we have two major ways
of instrumenting code:
- Prometheus metrics – by computing various metrics in code and exposing them via the
prometheuscrate. - Execution tracing – this shows up in the code as invocations of functionality provided by the
tracingcrate.
The focus of this document is to provide information on how to effectively work with the data collected by the execution tracing approach to instrumentation.
Gathering and Viewing the Traces
Tracing the execution of the code produces two distinct types of data: spans and events. These then
are exposed as either logs (representing mostly the events) seen in the standard output of the
neard process or sent onwards to an opentelemetry collector.
When deciding how to instrument a specific part of the code, consider the following decision tree:
- Do I need execution timing information? If so, use a span; otherwise
- Do I need call stack information? If so, use a span; otherwise
- Do I need to preserve information about inputs or outputs to a specific section of the code? If so, use key-values on a pre-existing span or an event; otherwise
- Use an event if it represents information applicable to a single point of execution trace.
As of writing (February 2024) our codebase uses spans somewhat sparsely and relies on events heavily to expose information about the execution of the code. This is largely a historical accident due to the fact that for a long time stdout logs were the only reasonable way to extract information out of the running executable.
Today we have more tools available to us. In production environments and environments replicating said environment (i.e. GCP environments such as mocknet) there's the ability to push this data to Grafana Loki (for events) and Tempo (for spans and events alike), so long as the amount of data is within reason. For that reason it is critical that the event and span levels are chosen appropriately and in consideration with the frequency of invocations. In local environments developers can use projects like Jaeger, or set up the Grafana stack if they wish to use a consistent interfaces.
It is still more straightforward to skip all the setup necessary for tracing, but relying exclusively on logs only increases noise for the other developers and makes it ever so slightly harder to extract signal in the future. Keep this trade off in mind.
Spans
We have a style guide section on the use of Spans, please make yourself familiar with it.
Every tracing::debug_span!() creates a new span, and usually it is attached to its parent
automatically.
However, a few corner cases exist.
do_apply_chunks()starts 4 sub-tasks in parallel and waits for their completion. To make it work, the parent span is passed explicitly to the sub-tasks.- Inter-process tracing is theoretically available, but I have never tested it. The plan was to
test it as soon as the Canary images get updated 😭 Therefore it most likely doesn’t work. Each
PeerMessageis injected withTraceContext(1, 2) and the receiving node extracts that context and all spans generated in handling that message should be parented to the trace from another node. - Some spans are created using
info_span!()but they are few and mostly for the logs. Exporting only info-level spans doesn’t give any useful tracing information in Grafana.
Configuration
The Tracing documentation page in nearone's Outline documents the steps necessary to start moving the trace data from the node to Nearone's Grafana Cloud instance. Once you set up your nodes, you can use the explore page to verify that the traces are coming through.
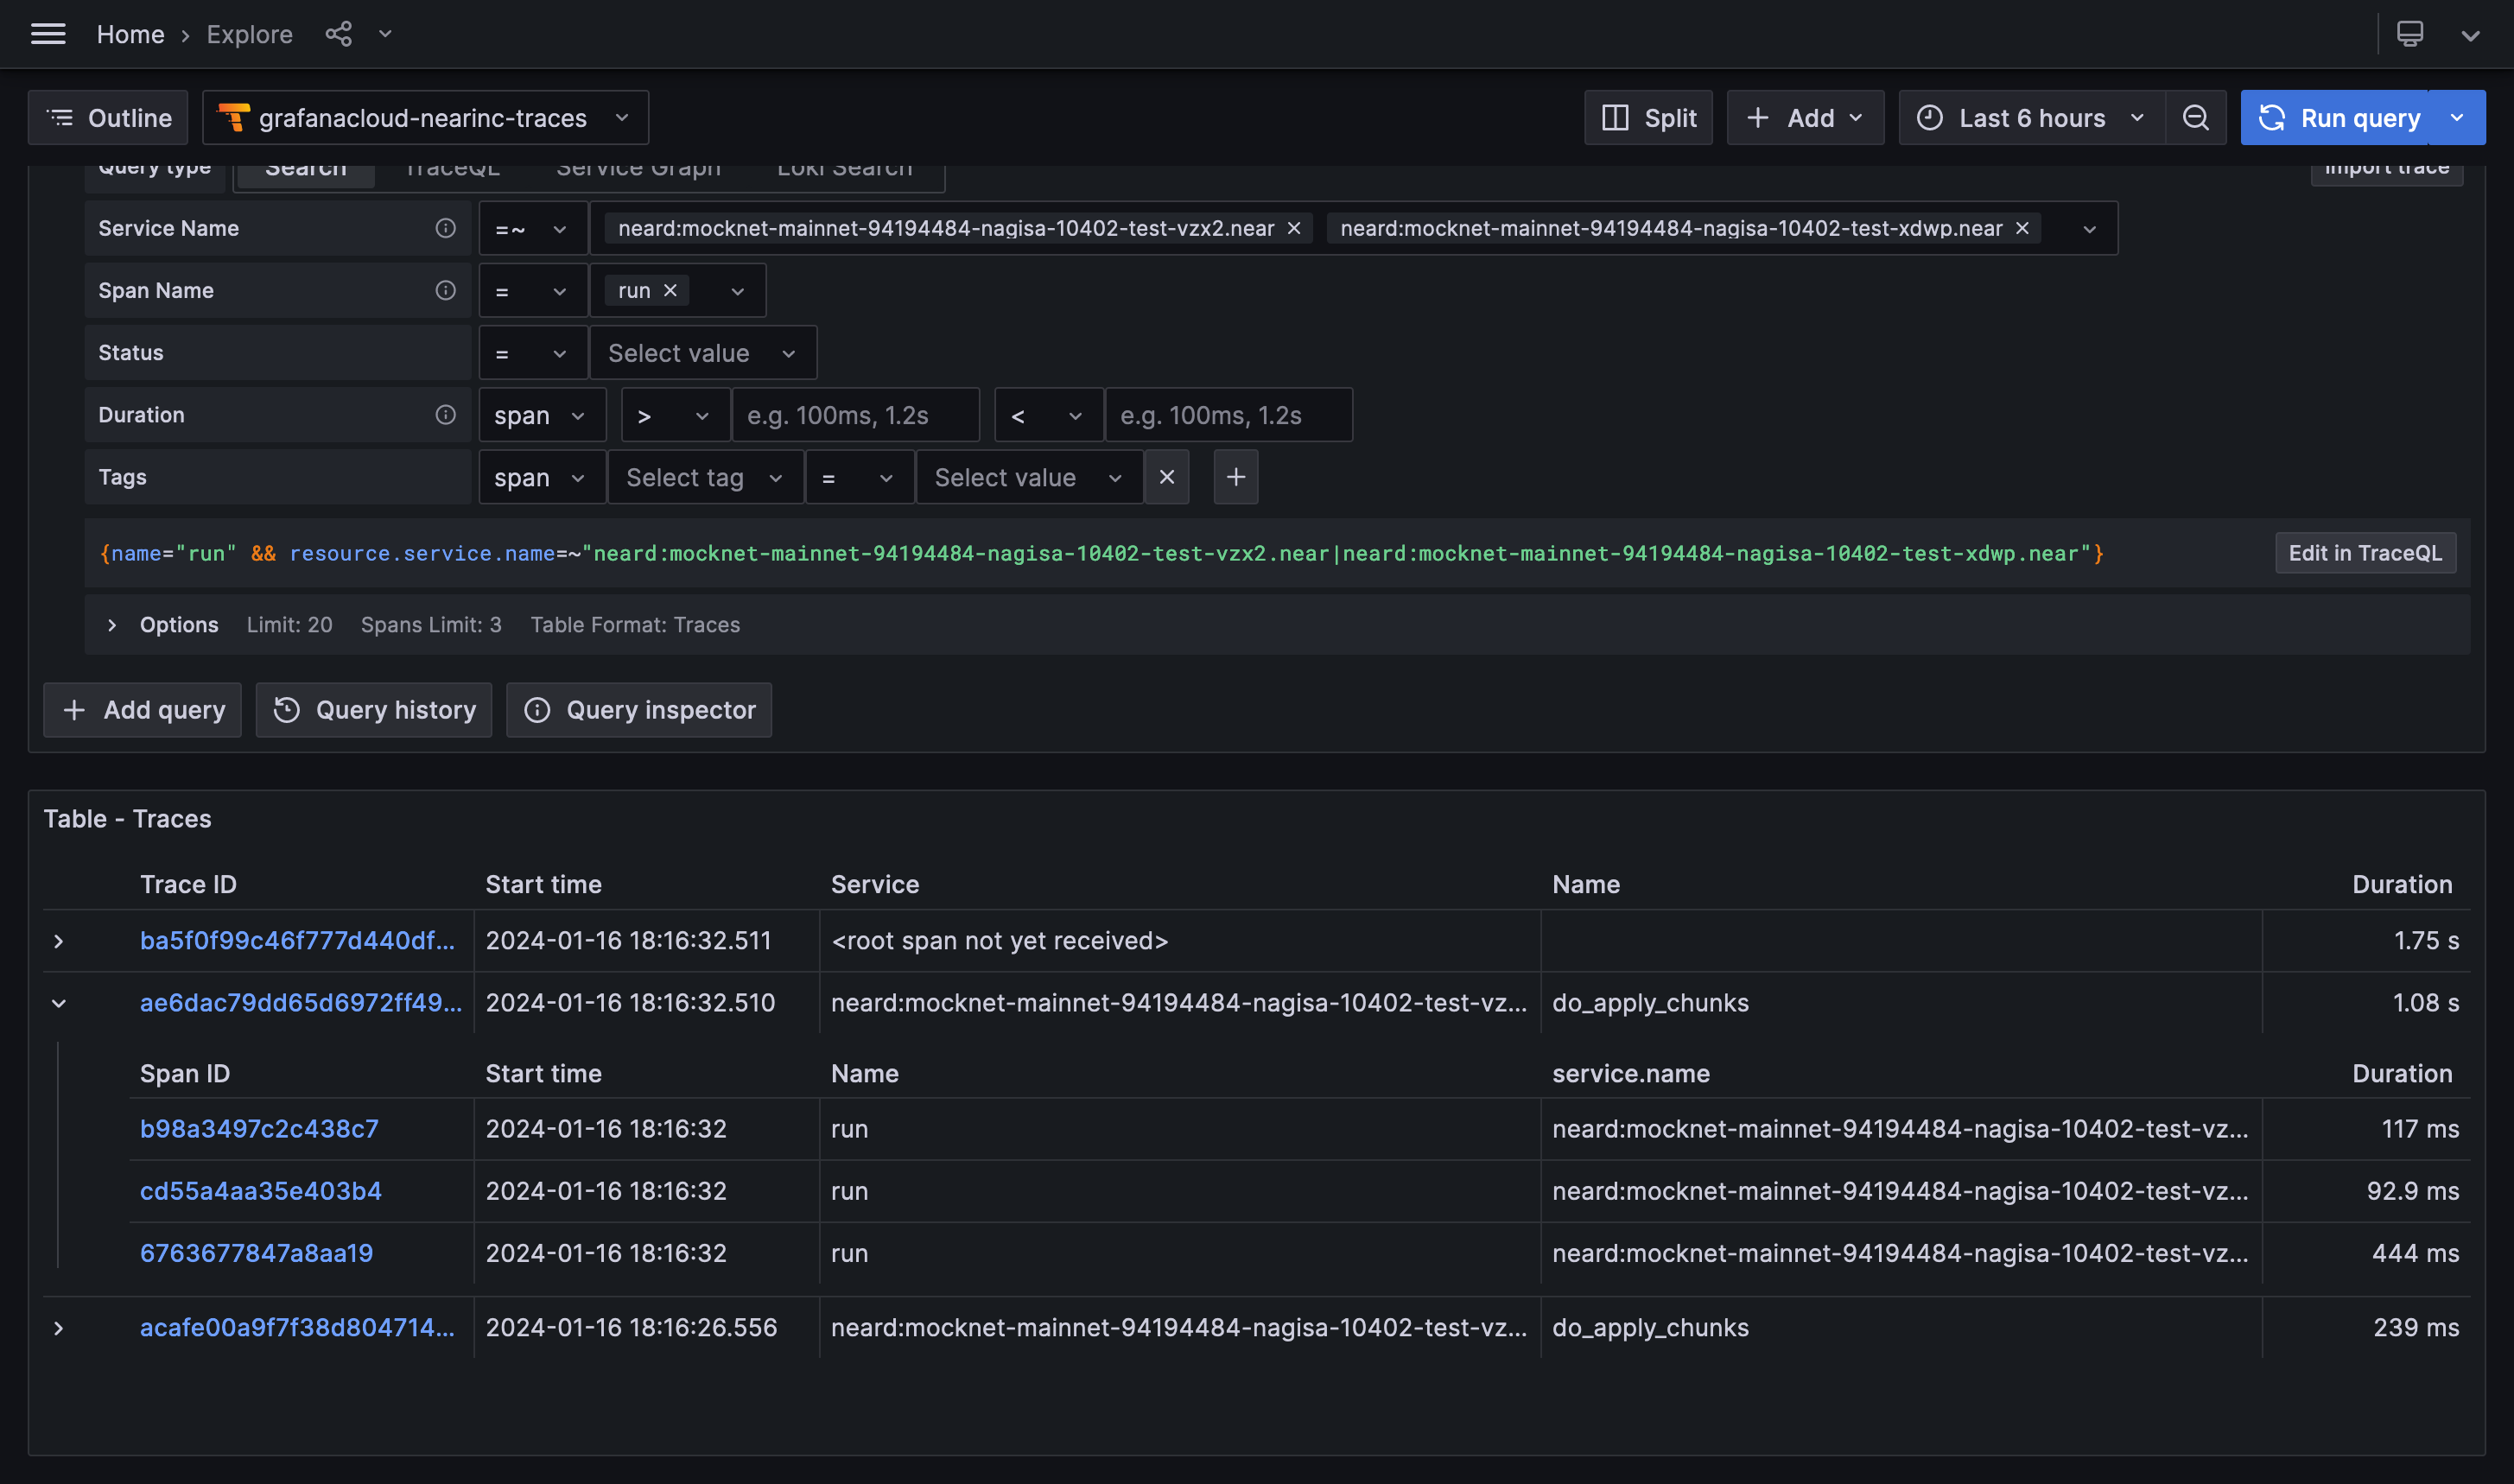
If the traces are not coming through quite yet, consider using the ability to set logging
configuration at runtime. Create $NEARD_HOME/log_config.json file with the following contents:
{ "opentelemetry": "info" }
Or optionally with rust_log setting to reduce logging on stdout:
{ "opentelemetry": "info", "rust_log": "WARN" }
and invoke sudo pkill -HUP neard. Double check that the collector is running as well.
Good to know: You can modify the event/span/log targets you’re interested in just like when setting the
RUST_LOGenvironment variable, including target filters. If you're setting verbose levels, consider selecting specific targets you're interested in too. This will help to keep trace ingest costs down.For more information about the dynamic settings refer to
core/dyn-configscode in the repository.
Local development
TODO: the setup is going to depend on whether one would like to use grafana stack or just jaeger or something else. We should document setting either of these up, including the otel collector and such for a full end-to-end setup. Success criteria: running integration tests should allow you to see the traces in your grafana/jaeger. This may require code changes as well.
Using the Grafana Stack here gives the benefit of all of the visualizations that are built-in. Any dashboards you build are also portable between the local environment and the Grafana Cloud instance. Jaeger may give a nicer interactive exploration ability. You can also set up both if you wish.
Visualization
Now that the data is arriving into the databases, it is time to visualize the data to determine what you want to know about the node. The only general advise I have here is to check that the data source is indeed tempo or loki.
Explore
Initial exploration is best done with Grafana's Explore tool or some other mechanism to query and display individual traces.
The query builder available in Grafana makes the process quite straightforward to start with, but
is also somewhat limited. Underlying TraceQL has many more
features that are not available through the
builder. For example, you can query data in somewhat of a relational manner, such as this query
below queries only spans named process_receipt that take 50ms when run as part of new_chunk
processing for shard 3!
{ name="new_chunk" && span.shard_id = "3" } >> { name="process_receipt" && duration > 50ms }
Good to know: When querying, keep in mind the "Options" dropdown that allows you to specify the limit of results and the format in which these results are presented! In particular, the "Traces/Spans" toggle will affect the durations shown in the result table.
Once you click on a span of interest, Grafana will open you a view with the trace that contains said span, where you can inspect both the overall trace and the properties of the span:
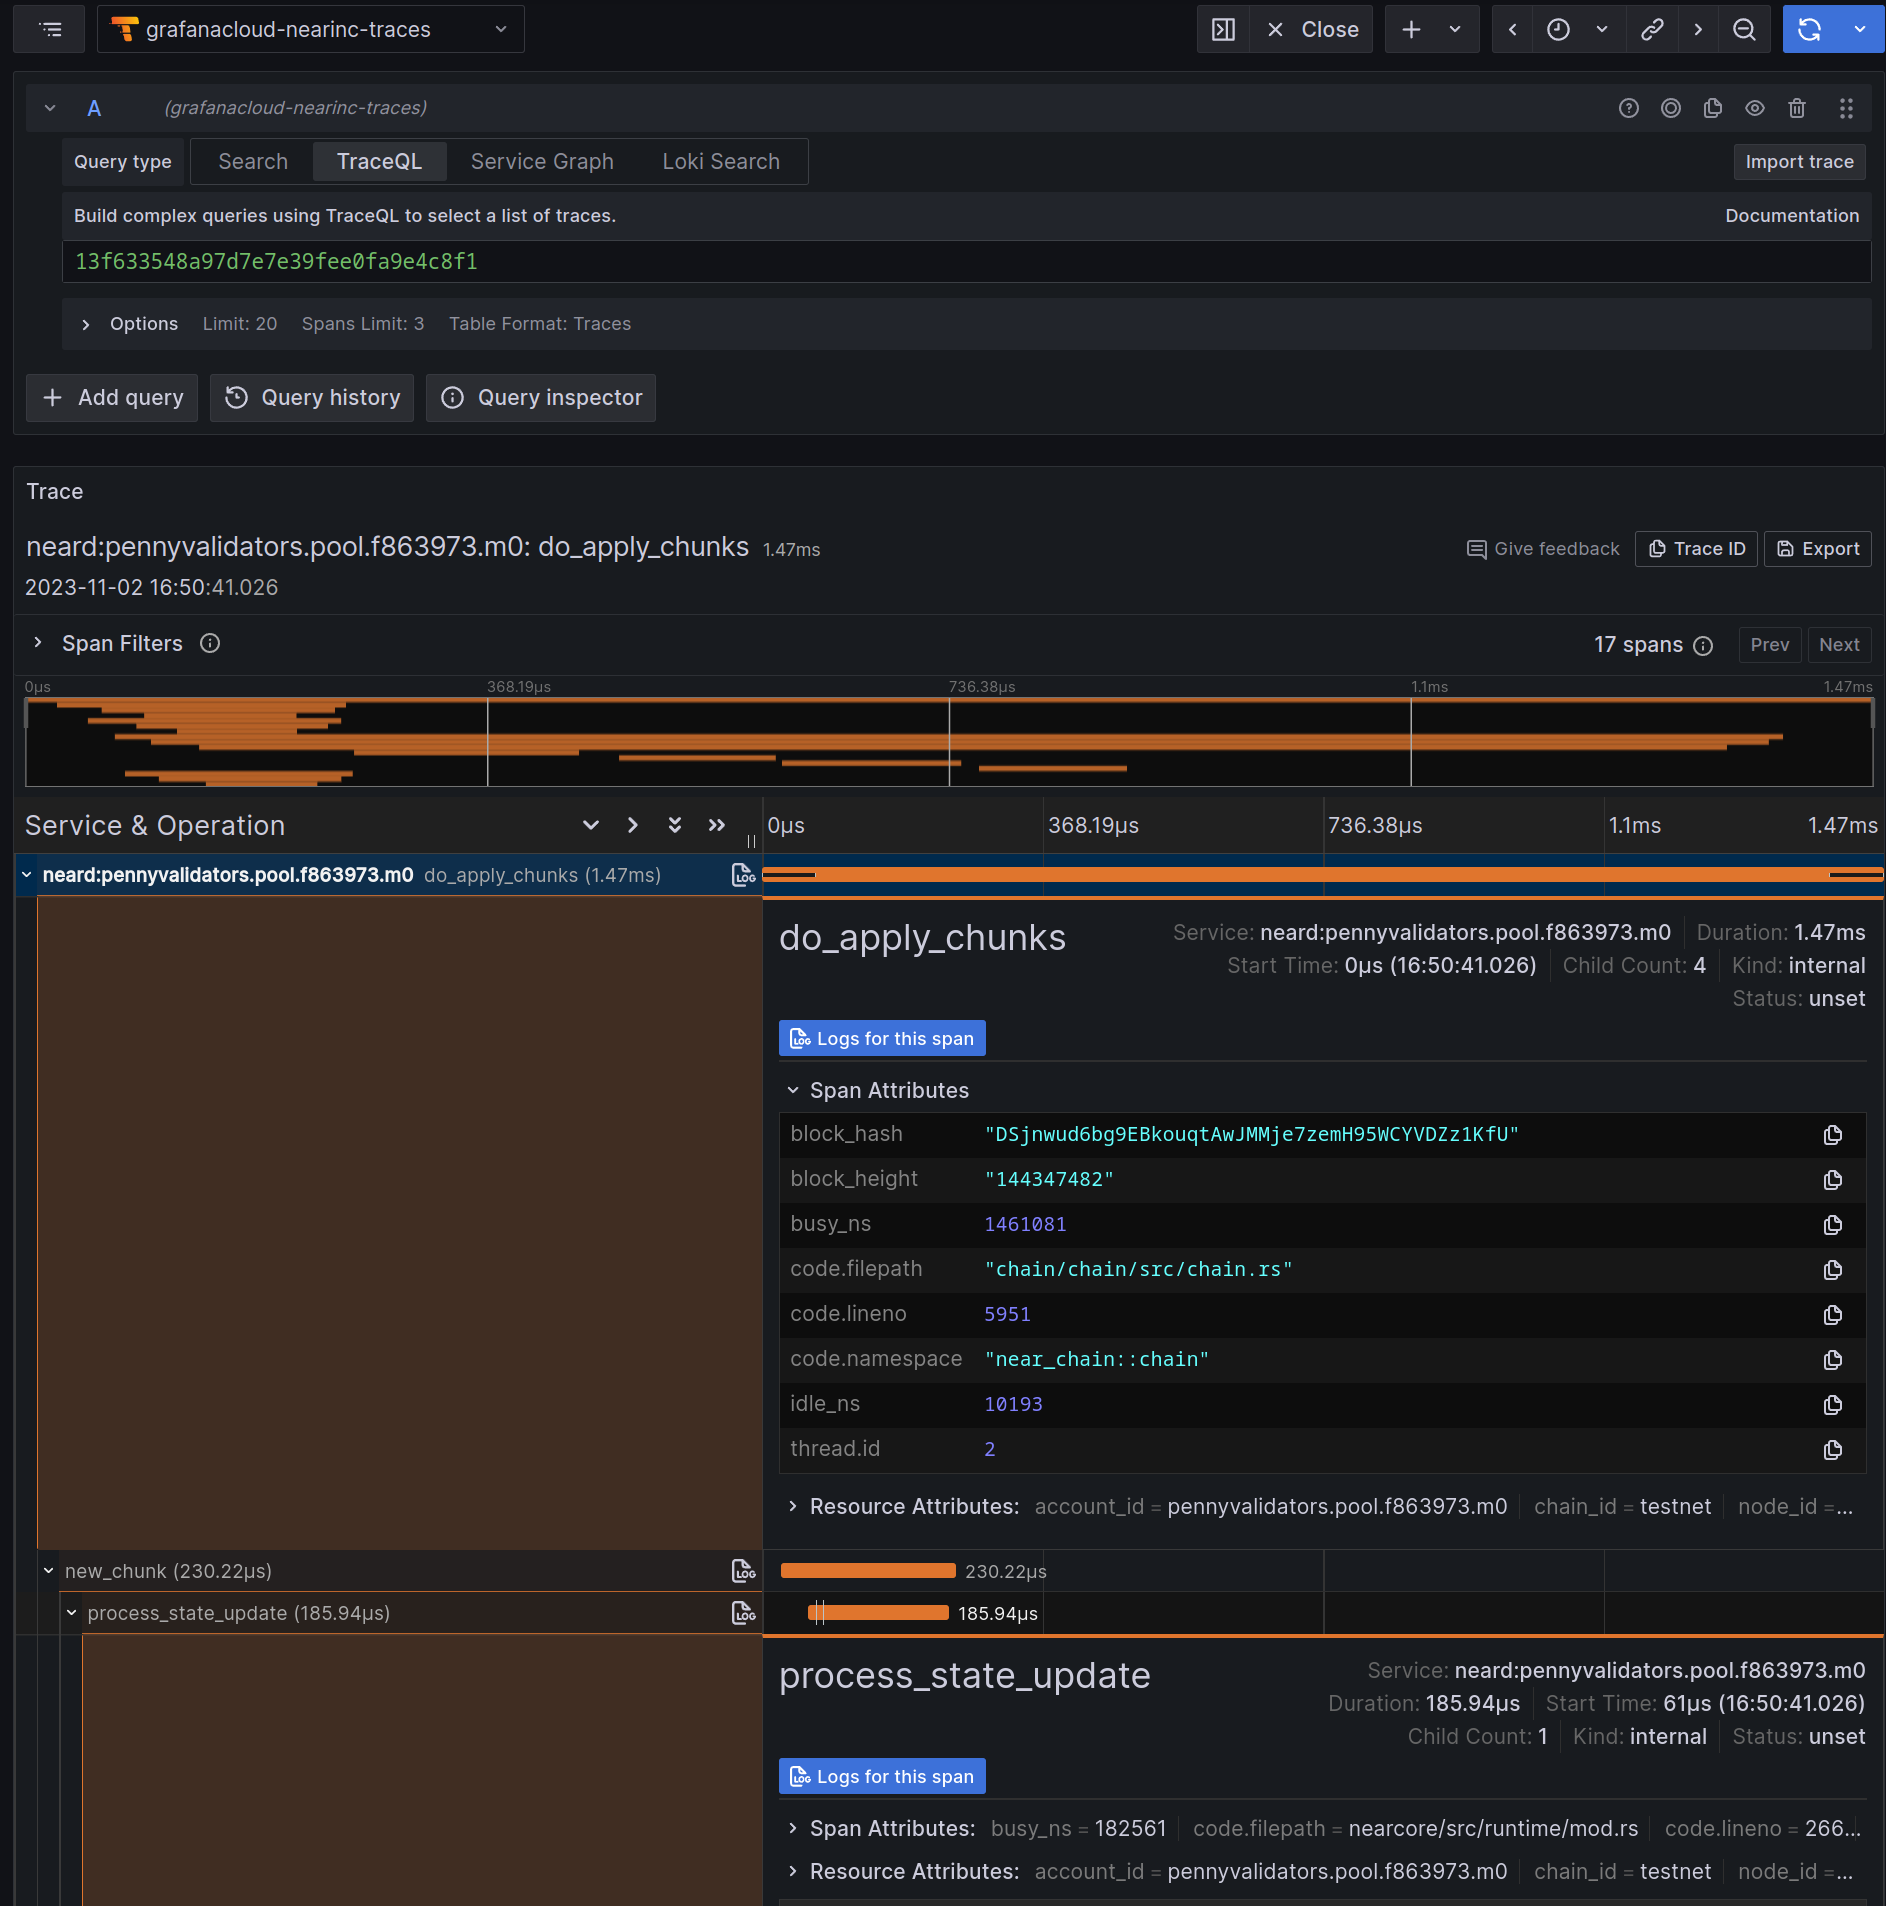
Dashboards
Once you have arrived at an interesting query, you may be inclined to create a dashboard that summarizes the data without having to dig into individual traces and spans.
As an example the author was interested in checking the execution speed before and after a change in a component. To make the comparison visual, the span of interest was graphed using the histogram visualization in order to obtain the following result. In this graph the Y axis displays the number of occurrences for spans that took X-axis long to complete.
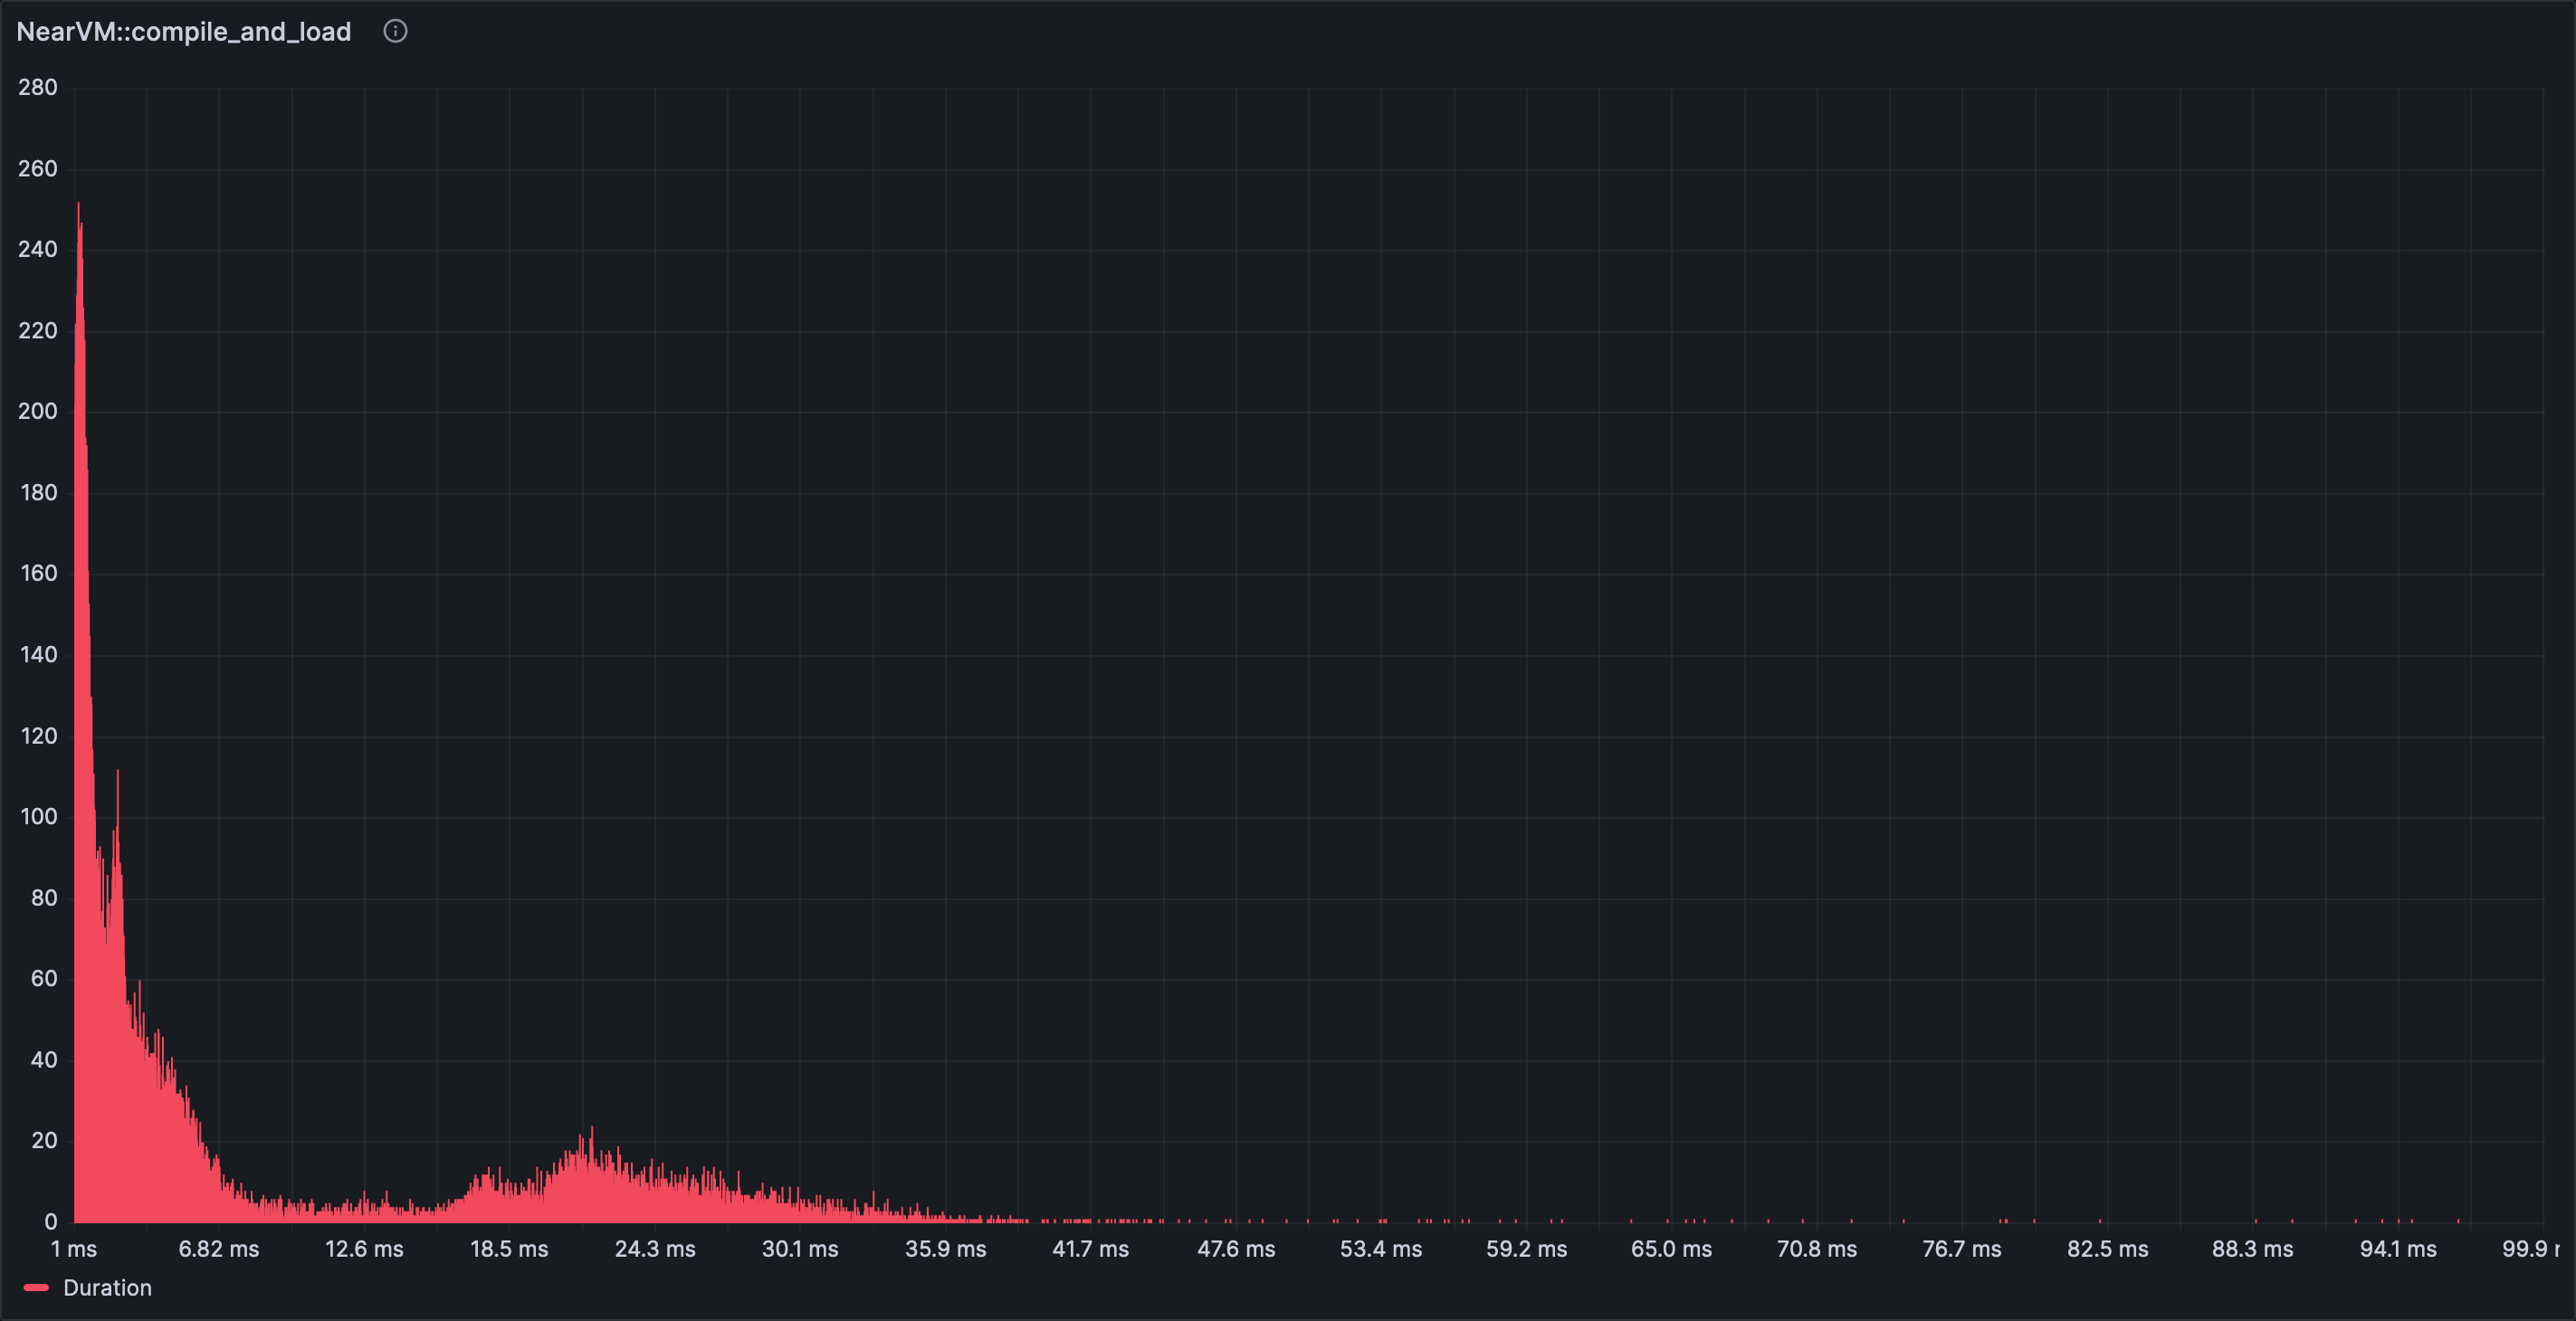
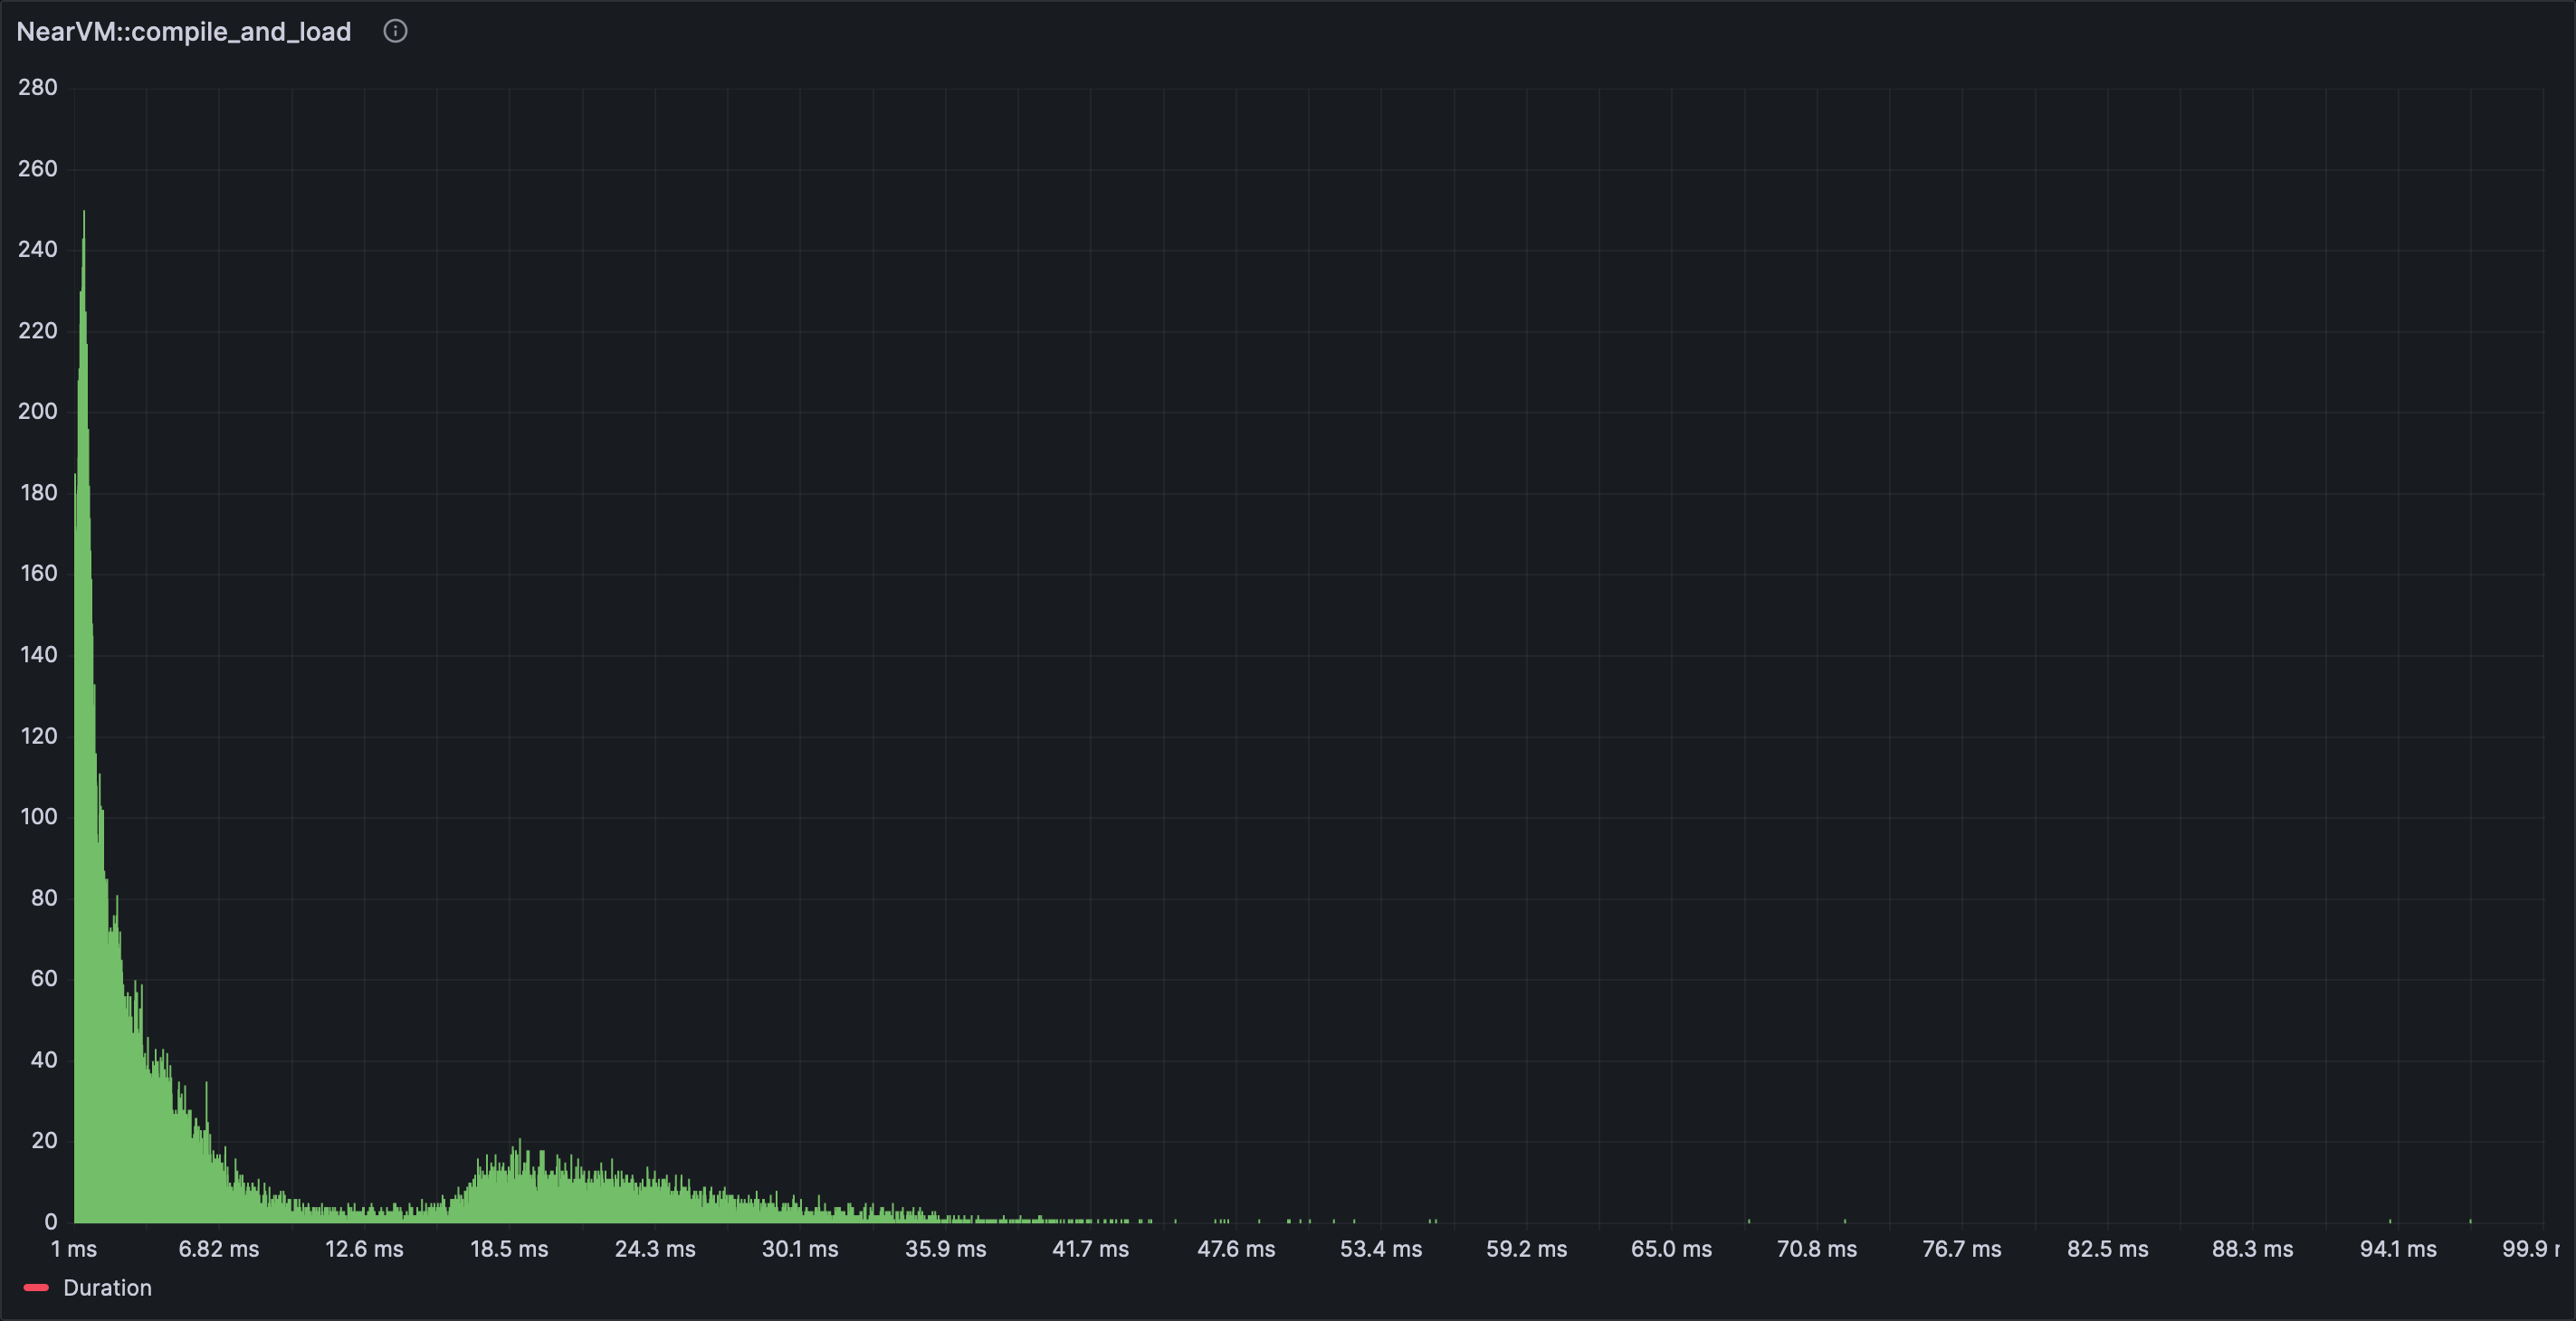
In general most of the panels work with tracing results directly but some of the most interesting ones do not. It is necessary to experiment with certain options and settings to have grafana panels start showing data. Some notable examples:
- Time series – a “Prepare time series” data transformation with “Multi-frame time series” has to be added;
- Histogram – make sure to use "spans" table format option;
- Heatmap - set “Calculate from data” option to “Yes”;
- Bar chart – works out of the box, but x axis won't be readable ever.
You can also add a panel that shows all the trace events in a log-like representation using the log or table visualization.
Multiple nodes
One frequently asked question is whether Grafana lets you distinguish between nodes that export tracing information.
The answer is yes.
In addition to span attributes, each span has resource attributes. There you'll find properties
like node_id which uniquely identify a node.
account_idis theaccount_idfromvalidator_key.json;chain_idis taken fromgenesis.json;node_idis the public key fromnode_key.json;service.nameisaccount_idif that is available, otherwise it isnode_id.
Futex contention
Futex contention occurs when multiple threads compete for access to shared resources protected by futexes (fast user-space mutexes). Futexes are efficient synchronization mechanisms in the Linux kernel, but contention can lead to performance bottlenecks in multithreaded programs.
Analyzing futex contention helps identify which locks are most contended and take the longest to resolve.
Setup
The first step is to build a profiling-tuned build of neard:
cargo build --release --config .cargo/config.profiling.toml -p neard
The second step involves compiling a tool designed to identify futex contention: futexctn. The following snippet demonstrates how to set up a neard node on GCP to collect lock contention data:
sudo sysctl kernel.perf_event_paranoid=0 && sudo sysctl kernel.kptr_restrict=0
sudo apt install -y clang llvm git libelf-dev
git clone https://github.com/iovisor/bcc.git
cd bcc/libbpf-tools/
git submodule update --init --recursive
make -j8
Finally, execute the futexctn binary for a chosen duration to gather contention statistics:
sudo ./futexctn -p $(pgrep neard) -T
Understanding futexctn's output
Below is an example section of the tool's output, illustrating the contention of a lock:
neard0[55783] lock 0x79a1b1dfcfb0 contended 41 times, 22 avg msecs [max: 48 msecs, min 5 msecs]
-
syscall
_ZN10near_store4trie4Trie17get_optimized_ref17h8d5fd8c67e262ab1E
_ZN10near_store4trie4Trie3get17h11d4bcd3667e3c8fE
_ZN85_$LT$near_store..trie..update..TrieUpdate$u20$as$u20$near_store..trie..TrieAccess$GT$3get17h041c58f313ed6d6cE
_ZN10near_store5utils11get_account17hf3071e79288206c0E
_ZN12node_runtime8verifier25get_signer_and_access_key17hca85f102c5a0241bE
_ZN92_$LT$near_chain..runtime..NightshadeRuntime$u20$as$u20$near_chain..types..RuntimeAdapter$GT$24can_verify_and_charge_tx17hb1907151d54f3c6bE
_ZN11near_client11rpc_handler10RpcHandler10process_tx17h3ca7fec97c6dd01eE
_ZN110_$LT$actix..sync..SyncContextEnvelope$LT$M$GT$$u20$as$u20$actix..address..envelope..EnvelopeProxy$LT$A$GT$$GT$6handle17h0f78e99e6ce63395E
_ZN3std3sys9backtrace28__rust_begin_short_backtrace17hd5ed81d58d44f867E
_ZN4core3ops8function6FnOnce40call_once$u7b$$u7b$vtable.shim$u7d$$u7d$17hc18f360a04c1b975E
_ZN3std3sys3pal4unix6thread6Thread3new12thread_start17hcc5ed016d554f327E
[unknown]
-
msecs : count distribution
0 -> 1 : 0 | |
2 -> 3 : 0 | |
4 -> 7 : 10 |*********************** |
8 -> 15 : 10 |*********************** |
16 -> 31 : 4 |********* |
32 -> 63 : 17 |****************************************|
Notes on the output:
- The first line shows the number of times the lock was contended and the average duration of contention.
- The middle section provides the stack trace of the thread that locked the futex.
- The bottom section contains a histogram representing the contention duration distribution.
Things to watch out for
Some instances of contention are not caused by locks being held for extended periods but are instead due to programmatic waits or sleeps. These can be identified either by examining the stack trace or by noticing that their durations are consistently rounded numbers.
Example:
tokio-runtime-w[56073] lock 0x79a1ae9f9fb0 contended 9 times, 1000 avg msecs [max: 1003 msecs, min 1000 msecs]
Code Style
This document specifies the code style to use in the nearcore repository. The primary goal here is to achieve consistency, maintain it over time, and cut down on the mental overhead related to style choices.
Right now, nearcore codebase is not perfectly consistent, and the style
acknowledges this. It guides newly written code and serves as a tie breaker for
decisions. Rewriting existing code to conform 100% to the style is not a goal.
Local consistency is more important: if new code is added to a specific file,
it's more important to be consistent with the file rather than with this style
guide.
This is a live document, which intentionally starts in a minimal case. When doing code-reviews, consider if some recurring advice you give could be moved into this document.
Formatting
Use rustfmt for minor code formatting decisions. This rule is enforced by CI
Rationale: rustfmt style is almost always good enough, even if not always
perfect. The amount of bike shedding saved by rustfmt far outweighs any
imperfections.
Idiomatic Rust
While the most important thing is to solve the problem at hand, we strive to
implement the solution in idiomatic Rust, if possible. To learn what is
considered idiomatic Rust, a good start are the
Rust API guidelines
(but keep in mind that nearcore is not a library with public API, not all
advice applies literally).
When in doubt, ask question in the Rust 🦀 Zulip stream or during code review.
Rationale:
- Consistency: there's usually only one idiomatic solution amidst many non-idiomatic ones.
- Predictability: you can use the APIs without consulting documentation.
- Performance, ergonomics and correctness: language idioms usually reflect learned truths, which might not be immediately obvious.
Style
This section documents all micro-rules which are not otherwise enforced by
rustfmt.
Avoid AsRef::as_ref
When you have some concrete type, prefer .as_str, .as_bytes, .as_path over
generic .as_ref. Only use .as_ref when the type in question is a generic
T: AsRef<U>.
#![allow(unused)] fn main() { // GOOD fn log_validator(account_id: AccountId) { metric_for(account_id.as_str()) .increment() } // BAD fn log_validator(account_id: AccountId) { metric_for(account_id.as_ref()) .increment() } }
Note that Option::as_ref, Result::as_ref are great, do use them!
Rationale: Readability and churn-resistance. There might be more than one
AsRef<U> implementation for a given type (with different Us). If a new
implementation is added, some of the .as_ref() calls might break. See also
this issue.
Avoid references to Copy-types
Various generic APIs in Rust often return references to data (&T). When T is
a small Copy type like i32, you end up with &i32 while many API expect
i32, so dereference has to happen somewhere. Prefer dereferencing as early
as possible, typically in a pattern:
#![allow(unused)] fn main() { // GOOD fn compute(map: HashMap<&'str, i32>) { if let Some(&value) = map.get("key") { process(value) } } fn process(value: i32) { ... } // BAD fn compute(map: HashMap<&'str, i32>) { if let Some(value) = map.get("key") { process(*value) } } fn process(value: i32) { ... } }
Rationale: If the value is used multiple times, dereferencing in the pattern saves keystrokes. If the value is used exactly once, we just want to be consistent. Additional benefit of early deref is reduced scope of borrow.
Note that for some big Copy types, notably CryptoHash, we sometimes use
references for performance reasons. As a rule of thumb, T is considered big if
size_of::<T>() > 2 * size_of::<usize>().
Prefer for loops over for_each and try_for_each methods
Iterators offer for_each and try_for_each methods which allow executing
a closure over all items of the iterator. This is similar to using a for loop
but comes with various complications and may lead to less readable code. Prefer
using a loop rather than those methods, for example:
#![allow(unused)] fn main() { // GOOD for outcome_with_id in result? { *total_gas_burnt = total_gas_burnt .checked_add_result(outcome_with_id.outcome.gas_burnt)?; outcomes.push(outcome_with_id); } // BAD result?.into_iter().try_for_each( |outcome_with_id: ExecutionOutcomeWithId| -> Result<(), RuntimeError> { *total_gas_burnt = total_gas_burnt .checked_add_result(outcome_with_id.outcome.gas_burnt)?; outcomes.push(outcome_with_id); Ok(()) }, )?; }
Rationale: The for_each and try_for_each method don’t play nice with
break and continue statements nor do they mesh well with async IO (since
.await inside of the closure isn’t possible). And while try_for_each allows
for the use of question mark operator, one may end up having to uses it twice:
once inside the closure and second time outside the call to try_for_each.
Furthermore, usage of the functions often introduce some minor syntax noise.
There are situations when those methods may lead to more readable code. Common example are long call chains. Even then such code may evolve with the closure growing and leading to less readable code. If advantages of using the methods aren’t clear cut, it’s usually better to err on side of more imperative style.
Lastly, anecdotally the methods (e.g. when used with chain or flat_map) may
lead to faster code. This intuitively makes sense but it’s worth to keep in
mind that compilers are pretty good at optimizing and in practice may generate
optimal code anyway. Furthermore, optimizing code for readability may be more
important (especially outside of hot path) than small performance gains.
Prefer to_string to format!("{}")
Prefer calling to_string method on an object rather than passing it through
format!("{}") if all you’re doing is converting it to a String.
#![allow(unused)] fn main() { // GOOD let hash = block_hash.to_string(); let msg = format!("{}: failed to open", path.display()); // BAD let hash = format!("{block_hash}"); let msg = path.display() + ": failed to open"; }
Rationale: to_string is shorter to type and also faster.
Import Granularity
Group imports by module, but not deeper:
#![allow(unused)] fn main() { // GOOD use std::collections::{hash_map, BTreeSet}; use std::sync::Arc; // BAD - nested groups. use std::{ collections::{hash_map, BTreeSet}, sync::Arc, }; // BAD - not grouped together. use std::collections::BTreeSet; use std::collections::hash_map; use std::sync::Arc; }
This corresponds to "rust-analyzer.imports.granularity.group": "module" setting
in rust-analyzer
(docs).
Rationale: Consistency, matches existing practice.
Import Blocks
Do not separate imports into groups with blank lines. Write a single block of
imports and rely on rustfmt to sort them.
#![allow(unused)] fn main() { // GOOD use crate::types::KnownPeerState; use borsh::BorshSerialize; use near_primitives::utils::to_timestamp; use near_store::{DBCol::Peers, Store}; use rand::seq::SliceRandom; use std::collections::HashMap; use std::net::SocketAddr; // BAD -- several groups of imports use std::collections::HashMap; use std::net::SocketAddr; use borsh::BorshSerialize; use rand::seq::SliceRandom; use near_primitives::utils::to_timestamp; use near_store::{DBCol::Peers, Store}; use crate::types::KnownPeerState; }
Rationale: Consistency, ease of automatic enforcement. Today, stable rustfmt can't split imports into groups automatically, and doing that manually consistently is a chore.
Derives
When deriving an implementation of a trait, specify a full path to the traits provided by the external libraries:
#![allow(unused)] fn main() { // GOOD #[derive(Copy, Clone, serde::Serialize, thiserror::Error, strum::Display)] struct Grapefruit; // BAD use serde::Serialize; use thiserror::Error; use strum::Display; #[derive(Copy, Clone, Serialize, Error, Display)] struct Banana; }
As an exception to this rule, it is okay to use either style when the derived trait already
includes the name of the library (as would be the case for borsh::BorshSerialize.)
Rationale: Specifying a full path to the externally provided derivations here makes it
straightforward to differentiate between the built-in derivations and those provided by the
external crates. The surprise factor for derivations sharing a name with the standard
library traits (Display) is reduced and it also acts as natural mechanism to tell apart names
prone to collision (Serialize), all without needing to look up the list of imports.
Arithmetic integer operations
Use methods with an appropriate overflow handling over plain arithmetic operators (+-*/%) when
dealing with integers.
// GOOD
a.wrapping_add(b);
c.saturating_sub(2);
d.widening_mul(3); // NB: unstable at the time of writing
e.overflowing_div(5);
f.checked_rem(7);
// BAD
a + b
c - 2
d * 3
e / 5
f % 7
If you’re confident the arithmetic operation cannot fail,
x.checked_[add|sub|mul|div](y).expect("explanation why the operation is safe") is a great
alternative, as it neatly documents not just the infallibility, but also why that is the case.
This convention may be enforced by the clippy::arithmetic_side_effects and
clippy::integer_arithmetic lints.
Rationale: By default the outcome of an overflowing computation in Rust depends on a few factors, most notably the compilation flags used. The quick explanation is that in debug mode the computations may panic (cause side effects) if the result has overflowed, and when built with optimizations enabled, these computations will wrap-around instead.
For nearcore and neard we have opted to enable the panicking behavior regardless of the
optimization level. By doing it this we hope to prevent accidental stabilization of protocol
mis-features that depend on incorrect handling of these overflows or similarly scary silent bugs.
The downside to this approach is that any such arithmetic operation now may cause a node to crash,
much like indexing a vector with a[idx] may cause a crash when idx is out-of-bounds. Unlike
indexing, however, developers and reviewers are not used to treating integer arithmetic operations
with the due suspicion. Having to make a choice, and explicitly spell out, how an overflow case
ought to be handled will result in an easier to review and understand code and a more resilient
project overall.
Standard Naming
- Use
-rather than_in crate names and in corresponding folder names. - Avoid single-letter variable names especially in long functions. Common
i,jetc. loop variables are somewhat of an exception but since Rust encourages use of iterators those cases aren’t that common anyway. - Follow standard Rust naming patterns such as:
- Don’t use
get_prefix for getter methods. A getter method is one which returns (a reference to) a field of an object. - Use
set_prefix for setter methods. An exception are builder objects which may use different a naming style. - Use
into_prefix for methods which consumeselfandto_prefix for methods which don’t.
- Don’t use
- Use
get_block_headerrather thanget_headerfor methods which return a block header. - Don’t use
_by_hashsuffix for methods which lookup chain objects (blocks, chunks, block headers etc.) by their hash (i.e. their primary identifier). - Use
_by_heightand similar suffixes for methods which lookup chain objects (blocks, chunks, block headers etc.) by their height or other property which is not their hash.
Rationale: Consistency.
Documentation
When writing documentation in .md files, wrap lines at approximately 80
columns.
<!-- GOOD -->
Manually reflowing paragraphs is tedious. Luckily, most editors have this
functionality built in or available via extensions. For example, in Emacs you
can use `fill-paragraph` (<kbd>M-q</kbd>), (neo)vim allows rewrapping with `gq`,
and VS Code has `stkb.rewrap` extension.
<!-- BAD -->
One sentence per-line is also occasionally used for technical writing.
We avoid that format though.
While convenient for editing, it may be poorly legible in unrendered form
<!-- BAD -->
Definitely don't use soft-wrapping. While markdown mostly ignores source level line breaks, relying on soft wrap makes the source completely unreadable, especially on modern wide displays.
Tracing
When emitting events and spans with tracing, use structured fields rather than
string formatting to include variable data. Always specify the target
explicitly, using the crate name or module path (e.g. chain::client) to group
related events.
#![allow(unused)] fn main() { // GOOD - structured fields with lowercase message debug!( target: "client", validator_id = self.client.validator_signer.get().map(|vs| { tracing::field::display(vs.validator_id()) }), %hash, "block.previous_hash" = %block.header().prev_hash(), "block.height" = block.header().height(), %peer_id, was_requested, "received block" ); // BAD - inline string formatting with capitalization debug!( target: "client", "{:?} Received block {} <- {} at {} from {}, requested: {}", self.client.validator_signer.get().map(|vs| vs.validator_id()), hash, block.header().prev_hash(), block.header().height(), peer_id, was_requested ); }
Rationale: Structured events are the core value proposition of the tracing ecosystem. They allow for immediately actionable data without post-processing, especially with advanced subscribers that output JSON or publish to distributed systems like OpenTelemetry. Structured logging also generally executes faster when logs are enabled.
Always use the tracing:: qualifier - Never use unqualified logging macros:
#![allow(unused)] fn main() { // GOOD - explicit qualifier tracing::error!(target: "client", ?err, "failed to process"); tracing::warn!(target: "sync", height, "state sync started"); // BAD - unqualified macros error!(target: "client", ?err, "failed to process"); warn!(target: "sync", height, "state sync started"); }
Rationale: Explicit qualification improves code clarity by making it immediately obvious that tracing infrastructure is being used. It also prevents naming conflicts with other logging libraries or macros, and makes the code easier to search and refactor.
Message Format Conventions
Follow these conventions for consistent, machine-friendly log messages:
- Use lowercase - Start messages with a lowercase letter
- No ending punctuation - Omit periods, ellipsis, or other punctuation
- Use commas for continuation - When a message contains multiple clauses, use commas instead of periods to connect them
#![allow(unused)] fn main() { // GOOD - comma for continuation tracing::warn!(target: "sync", "failed to connect, retrying in 200ms"); tracing::error!(target: "store", "database locked, waiting for release"); // BAD - period creates sentence fragment tracing::warn!(target: "sync", "failed to connect. retrying in 200ms"); tracing::error!(target: "store", "database locked. waiting for release"); }
Rationale: Using commas instead of periods maintains message flow and avoids creating sentence fragments. This keeps messages concise and parsable while still conveying multiple pieces of information.
- Fields before message - Place all structured fields before the message string
- Remove redundant prefixes - Don't repeat context from
targetor log level
#![allow(unused)] fn main() { // GOOD debug!(target: "sync", height, "transition to state sync"); error!(target: "client", ?err, "failed to process block"); // BAD debug!(target: "sync", "Sync: Transition to State Sync..."); error!(target: "client", "Error: failed to process block: {:?}", err); }
Field Formatting
Use the appropriate prefix for each field type:
field- Include field by name (Debug by default)field = expr- Explicitly compute and assign a value?field- Force Debug formatting ({:?})%field- Force Display formatting ({})
Recommended field ordering:
#![allow(unused)] fn main() { log_macro!( target: "target_name", // 1. Target (always required) field1, // 2. Simple field references field2 = expr, // 3. Computed fields ?debug_field, // 4. Debug-formatted fields %display_field, // 5. Display-formatted fields "message string" // 6. Message always last ); }
Additional Examples
Complex fields with context:
#![allow(unused)] fn main() { // GOOD warn!( target: "sync", %peer = peer.peer_info, peer_height = peer.highest_block_height, "banning peer for insufficient headers" ); // BAD warn!( target: "sync", "ban a peer: {}, for not providing enough headers. Peer's height: {}", peer.peer_info, peer.highest_block_height ); }
Error logging with context:
#![allow(unused)] fn main() { // GOOD error!( target: "runtime", thread_name = "worker", task_id = task.id, ?err, "failed to spawn thread" ); // BAD - missing context error!(target: "runtime", "failed to spawn the thread: {}", err); }
Rationale for these conventions:
- Searchability: Structured fields enable precise querying and filtering
- Automation: Log aggregation tools (Loki, Elasticsearch, OpenTelemetry) can automatically parse and index structured data
- Consistency: Predictable format improves readability and reduces cognitive load
- Machine-friendly: Lowercase, un-punctuated messages are easier for automated systems to parse and analyze
Spans
Use the spans to introduce context and grouping to and between events instead of manually adding such information as part of the events themselves. Most of the subscribers ingesting spans also provide a built-in timing facility, so prefer using spans for measuring the amount of time a section of code needs to execute.
Give spans simple names that make them both easy to trace back to code, and to
find a particular span in logs or other tools ingesting the span data. If a
span begins at the top of a function, prefer giving it a name of that function,
otherwise prefer a snake_case name.
When instrumenting asynchronous functions the #[tracing::instrument] macro or the
Future::instrument is required. Using Span::entered or a similar method that is not aware
of yield points will result in incorrect span data and could lead to difficult to troubleshoot
issues such as stack overflows.
Always explicitly specify the level, target, and skip_all options and do not rely on the
default values. skip_all avoids adding all function arguments as span fields which can lead
recording potentially unnecessary and expensive information. Carefully consider which information
needs recording and the cost of recording the information when using the fields option.
#![allow(unused)] fn main() { #[tracing::instrument( level = "trace", target = "network", "handle_sync_routing_table", skip_all )] async fn handle_sync_routing_table( clock: &time::Clock, network_state: &Arc<NetworkState>, conn: Arc<connection::Connection>, rtu: RoutingTableUpdate, ) { ... } }
In regular synchronous code it is fine to use the regular span API if you need to instrument portions of a function without affecting the code structure:
#![allow(unused)] fn main() { fn compile_and_serialize_wasmer(code: &[u8]) -> Result<wasmer::Module> { // Some code... { let _span = tracing::debug_span!(target: "vm", "compile_wasmer").entered(); // ... // _span will be dropped when this scope ends, terminating the span created above. // You can also `drop` it manually, to end the span early with `drop(_span)`. } // Some more code... } }
Rationale: Much as with events, this makes the information provided by spans
structured and contextual. This information can then be output to tooling in an
industry standard format, and can be interpreted by an extensive ecosystem of
tracing subscribers.
Event and span levels
The INFO level is enabled by default, use it for information useful for node
operators. The DEBUG level is enabled on the canary nodes, use it for
information useful in debugging testnet failures. The TRACE level is not
generally enabled, use it for arbitrary debug output.
Metrics
Consider adding metrics to new functionality. For example, how often each type of error was triggered, how often each message type was processed.
Rationale: Metrics are cheap to increment, and they often provide a significant insight into operation of the code, almost as much as logging. But unlike logging metrics don't incur a significant runtime cost.
Naming
Prefix all nearcore metrics with near_. Follow the
Prometheus naming convention
for new metrics.
Rationale: The near_ prefix makes it trivial to separate metrics exported
by nearcore from other metrics, such as metrics about the state of the machine
that runs neard.
Performance
In most cases incrementing a metric is cheap enough never to give it a second thought. However accessing a metric with labels on a hot path needs to be done carefully.
If a label is based on an integer, use a faster way of converting an integer
to the label, such as the itoa crate.
For hot code paths, re-use results of with_label_values() as much as possible.
Rationale: We've encountered issues caused by the runtime costs of incrementing metrics before. Avoid runtime costs of incrementing metrics too often.
Documentation
This chapter describes nearcore's approach to documentation. There are three primary types of documentation to keep in mind:
- The NEAR Protocol Specification (source code) is the formal description of the NEAR protocol. The reference nearcore implementation and any other NEAR client implementations must follow this specification.
- User docs (source code) explain what is NEAR and how to participate in the network. In particular, they contain information pertinent to the users of NEAR: validators and smart contract developers.
- Node Validator docs (source code) explain how to set up your own Validator node, RPC node, or Archival node, and participate in the network.
- Documentation for nearcore developers (source code) is the book you are reading right now! The target audience here is the contributors to the main implementation of the NEAR protocol (nearcore).
Overview
The bulk of the internal docs is within this book. If you want to write some kind of document, add it here! The architecture and practices chapters are intended for somewhat up-to-date normative documents. The misc chapter holds everything else.
This book is not intended for user-facing documentation, so don't worry about proper English, typos, or beautiful diagrams -- just write stuff! It can easily be improved over time with pull requests. For docs, we use a lightweight review process and try to merge any improvement as quickly as possible. Rather than blocking a PR on some stylistic changes, just merge it and submit a follow-up.
Note the "edit" button at the top-right corner -- super useful for fixing any typos you spot!
In addition to the book, we also have some "inline" documentation in the code.
For Rust, it is customary to have a per-crate README.md file and include it as
a doc comment via #![doc = include_str!("../README.md")] in lib.rs. We don't
require every item to be documented, but we certainly encourage documenting as
much as possible. If you spend some time refactoring or fixing a function,
consider adding a doc comment (///) to it as a drive-by improvement.
We currently don't render rustdoc, see #7836.
Book How To
We use mdBook to render a bunch of markdown files as a static website with a table of contents, search and themes. Full docs are here, but the basics are very simple.
To add a new page to the book:
- Add a
.mdfile somewhere in the./docsfolder. - Add a link to that page to the
SUMMARY.md. - Submit a PR (again, we promise to merge it without much ceremony).
The doc itself is in vanilla markdown.
To render documentation locally:
# Install mdBook
$ cargo install mdbook
$ mdbook serve --open ./docs
This will generate the book from the docs folder, open it in a browser and start a file watcher to rebuild the book every time the source files change.
Note that GitHub's default rendering mostly works just as well, so you don't need to go out of your way to preview your changes when drafting a page or reviewing pull requests to this book.
The book is deployed via the book GitHub Action workflow. This workflow runs mdBook and then deploys the result to GitHub Pages.
For internal docs, you often want to have pretty pictures. We don't currently have a recommended workflow, but here are some tips:
-
Don't add binary media files to Git to avoid inflating repository size. Rather, upload images as comments to this super-secret issue #7821, and then link to the images as
Use a single comment per page with multiple images.
-
Google Docs is an OK way to create technical drawings, you can add a link to the doc with source to that secret issue as well.
-
There's some momentum around using mermaid.js for diagramming, and there's an appropriate plugin for that. Consider if that's something you might want to use.
Tracking issues
nearcore uses so-called "tracking issues" to coordinate larger pieces of work
(e.g. implementation of new NEPs). Such issues are tagged with the
C-tracking-issue
label.
The goal of tracking issues is to serve as a coordination point. They can help new contributors and other interested parties come up to speed with the current state of projects. As such, they should link to things like design docs, todo-lists of sub-issues, existing implementation PRs, etc.
One can further use tracking issues to:
- get a feeling for what's happening in
nearcoreby looking at the set of open tracking issues. - find larger efforts to contribute to as tracking issues usually contain up-for-grab to-do lists.
- follow the progress of specific features by subscribing to the issue on GitHub.
If you are leading or participating in a larger effort, please create a tracking issue for your work.
Guidelines
- Tracking issues should be maintained in the
nearcorerepository. If the projects are security sensitive, then they should be maintained in thenearcore-privaterepository. - The issues should be kept up-to-date. At a minimum, all new context should be added as comments, but preferably the original description should be edited to reflect the current status.
- The issues should contain links to all the relevant design documents which should also be kept up-to-date.
- The issues should link to any relevant NEP if applicable.
- The issues should contain a list of to-do tasks that should be kept up-to-date as new work items are discovered and other items are done. This helps others gauge progress and helps lower the barrier of entry for others to participate.
- The issues should contain links to relevant Zulip discussions. Prefer open forums like Zulip for discussions. When necessary, closed forums like video calls can also be used but care should be taken to document a summary of the discussions.
- For security-sensitive discussions, use the appropriate private Zulip streams.
This issue is a good example of how tracking issues should be maintained.
Background
The idea of tracking issues is also used to track project work in the Rust language. See this post for a rough description and these issues for how they are used in Rust.
Security Vulnerabilities
The intended audience of the information presented here is developers working on the implementation of NEAR.
Are you a security researcher? Please report security vulnerabilities to security@near.org.
As nearcore is open source, all of its issues and pull requests are also publicly tracked on GitHub. However, from time to time, if a security-sensitive issue is discovered, it cannot be tracked publicly on GitHub. However, we should promote as similar a development process to work on such issues as possible. To enable this, below is the high-level process for working on security-sensitive issues.
-
There is a private fork of nearcore on GitHub. Access to this repository is restricted to the set of people who are trusted to work on and have knowledge about security-sensitive issues in nearcore.
This repository can be manually synced with the public nearcore repository using the following commands:
git remote add nearcore-public git@github.com:near/nearcore git remote add nearcore-private git@github.com:near/nearcore-private git fetch nearcore-public git push nearcore-private nearcore-public/master:master -
All security-sensitive issues must be created on the private nearcore repository. You must also assign one of the
[P-S0, P-S1]labels to the issue to indicate the severity of the issue. The two criteria to use to help you judge the severity are the ease of carrying out the attack and the impact of the attack. An attack that is easy to do or can have a huge impact should have theP-S0label andP-S1otherwise. -
All security-sensitive pull requests should also be created on the private nearcore repository. Note that once a PR has been approved, it should not be merged into the private repository. Instead, it should be first merged into the public repository and then the private fork should be updated using the steps above.
-
Once work on a security issue is finished, it needs to be deployed to all the impacted networks. Please contact the node team for help with this.
Fast Builds
nearcore is implemented in Rust and is a fairly sizable project, so it takes a while to build. This chapter collects various tips to make the development process faster.
Optimizing build times is a bit of a black art, so please do benchmarks on your machine to verify that the improvements work for you. Changing some configuration and making a typo, which prevents it from improving build times is an extremely common failure mode!
Rust Perf Book contains a section on compilation times as well!
Release Builds and Link Time Optimization
cargo build --release is obviously slower than cargo build. We enable full
lto (link-time optimization), so our -r builds are very slow, use a lot of
RAM, and don't utilize the available parallelism fully.
As debug builds are much too slow at runtime for many purposes, we have a custom
profile --profile dev-release which is equivalent to -r, except that the
time-consuming options such as LTO are disabled, and debug assertions are enabled.
Use --profile dev-release for most local development, or when connecting a
locally built node to a network. Use -r for production, or if you want to get
absolute performance numbers.
Linker
By default, rustc uses the default system linker, which tends to be quite
slow. Using lld (LLVM linker) or mold (very new, very fast linker) provides
big wins for many setups.
I don't know what's the official source of truth for using alternative linkers, I usually refer to this comment.
Usually, adding
[build]
rustflags = ["-C", "link-arg=-fuse-ld=lld"]
to ~/.cargo/config is the most convenient approach.
lld itself can be installed with sudo apt install lld (or the equivalent in
the distro/package manager of your choice).
Prebuilt RocksDB
By default, we compile RocksDB (a C++ project) from source during the neard
build. By linking to a prebuilt copy of RocksDB this work can be avoided
entirely. This is a huge win, especially if you clean the ./target directory
frequently.
To use a prebuilt RocksDB, set the ROCKSDB_LIB_DIR environment variable to
a location containing librocksdb.a:
export ROCKSDB_LIB_DIR=/usr/lib/x86_64-linux-gnu
cargo build -p neard
Note, that the system must provide a recent version of the library which,
depending on which operating system you’re using, may require installing packages
from a testing branch. For example, on Debian it requires installing
librocksdb-dev from the experimental repository:
Note: Based on which distro you are using this process will look different. Please refer to the documentation of the package manager you are using.
echo 'deb http://ftp.debian.org/debian experimental main contrib non-free' |
sudo tee -a /etc/apt/sources.list
sudo apt update
sudo apt -t experimental install librocksdb-dev
ROCKSDB_LIB_DIR=/usr/lib/x86_64-linux-gnu
export ROCKSDB_LIB_DIR
Global Compilation Cache
By default, Rust compiles incrementally, with the incremental cache and
intermediate outputs stored in the project-local ./target directory.
The sccache utility can be used to share
these artifacts between machines or checkouts within the same machine. sccache
works by intercepting calls to rustc and will fetch the cached outputs from
the global cache whenever possible. This tool can be set up as such:
cargo install sccache
export RUSTC_WRAPPER="sccache"
export SCCACHE_CACHE_SIZE="30G"
cargo build -p neard
Refer to the project’s README for further configuration options.
IDEs Are Bad For Environment Handling
Generally, the knobs in this section are controlled either via global
configuration in ~/.cargo/config or environment variables.
Environment variables are notoriously easy to lose, especially if you are working both from a command line and a graphical IDE. Double-check that the environment within which builds are executed is identical to avoid nasty failure modes such as full cache invalidation when switching from the CLI to an IDE or vice-versa.
direnv sometimes can be used to conveniently manage
project-specific environment variables.
General principles
- Every PR needs to have test coverage in place. Sending the code change and deferring tests for a future change is not acceptable.
- Tests need to either be sufficiently simple to follow or have good documentation to explain why certain actions are made and conditions are expected.
- When implementing a PR, make sure to run the new tests with the change disabled and confirm that they fail! It is extremely common to have tests that pass without the change that is being tested.
- The general rule of thumb for a reviewer is to first review the tests, and ensure that they can convince themselves that the code change that passes the tests must be correct. Only then the code should be reviewed.
- Have the assertions in the tests as specific as possible,
however do not make the tests change-detectors of the concrete implementation.
(assert only properties which are required for correctness).
For example, do not do
assert!(result.is_err()), expect the specific error instead.
Tests hierarchy
In the NEAR Reference Client we largely split tests into three categories:
- Relatively cheap sanity or fast fuzz tests: It includes all the
#[test]Rust tests not decorated by features. Our repo is configured in such a way that all such tests are run on every PR and failing at least one of them is blocking the PR from being merged.
To run such tests locally run cargo nextest run --all.
It requires nextest harness which can be installed by running cargo install cargo-nextest first.
- Expensive tests: This includes all the fuzzy tests that run many iterations,
as well as tests that spin up multiple nodes and run them until they reach a
certain condition. Such tests are decorated with
#[cfg(feature="expensive-tests")]. It is not trivial to enable features that are not declared in the top-level crate, and thus the easiest way to run such tests is to enable all the features by passing--all-featurestocargo nextest run, e.g:
cargo nextest run --package near-client -E 'test(=tests::cross_shard_tx::test_cross_shard_tx)' --all-features
- Python tests: We have an infrastructure to spin up nodes, both locally and
remotely, in python, and interact with them using RPC. The infrastructure and
the tests are located in the
pytestfolder. The infrastructure is relatively straightforward, see for exampleblock_production.pyhere. See theTest infrastructuresection below for details.
Expensive and python tests are not part of CI, and are run by a custom nightly runner. The results of the latest runs are available here. Today, test runs launch approximately every 5-6 hours. For the latest results look at the second run, since the first one has some tests still scheduled to run.
Test infrastructure
Different levels of the reference implementation have different infrastructures available to test them.
Client
The Client is separated from the runtime via a RuntimeAdapter trait for historical reasons.
In production, it uses NightshadeRuntime which uses real runtime and epoch managers.
The same should be used in tests.
Most of the tests in the client work by setting up either a single node (via
setup_mock()) or multiple nodes (via setup_mock_all_validators()) and then
launching the nodes and waiting for a particular message to occur, with a
predefined timeout.
For the most basic example of using this infrastructure see produce_two_blocks
in
tests/process_blocks.rs.
- The callback (
Box::new(move |msg, _ctx, _| { ...) is what is executed whenever the client sends a message. The return value of the callback is sent back to the client, which allows for testing relatively complex scenarios. The tests generally expect a particular message to occur, in this case, the tests expect two blocks to be produced.near_async::shutdown_all_actors();is the way to stop the test and mark it as passed. - See
near_network::test_utils::wait_or_timeoutfor how to wait for some condition to be true or panic if it doesn't within a certain time.
For an example of a test that launches multiple nodes, see
chunks_produced_and_distributed_common in
integration-tests/src/tests/client/chunks_management.rs | Network chunk management test.
The setup_mock_all_validators function is the key piece of infrastructure here.
Runtime
Tests for Runtime are listed in tests/test_cases_runtime.rs.
To run a test, usually, a mock RuntimeNode is created via create_runtime_node().
In its constructor, the Runtime is created in the
get_runtime_and_trie_from_genesis function.
Inside a test, an abstracted User is used for sending specific actions to the
runtime client. The helper functions function_call, deploy_contract, etc.
eventually lead to the Runtime.apply method call.
For setting usernames during playing with transactions, use default names
alice_account, bob_account, eve_dot_alice_account, etc.
Network
Chain, Epoch Manager, Runtime and other low-level changes
When building new features in the chain, epoch_manager and network crates,
make sure to build new components sufficiently abstract so that they can be tested
without relying on other components.
For example, see tests for doomslug here, or for promises in runtime here.
Python tests
See this page for detailed coverage of how to write a python test.
We have a python library that allows one to create and run python tests.
To run python tests, from the nearcore repo the first time, do the following:
cd pytest
virtualenv . --python=python3
. .env/bin/activate
pip install -r requirements.txt
python tests/sanity/block_production.py
This will create a python virtual environment, activate the environment, install
all the required packages specified in the requirements.txt file and run the
tests/sanity/block_production.py file. After the first time, we only need to
activate the environment and can then run the tests:
cd pytest
. .env/bin/activate
python tests/sanity/block_production.py
Use pytest/tests/sanity/block_production.py as the basic example of starting a
cluster with multiple nodes, and doing RPC calls.
See pytest/tests/sanity/deploy_call_smart_contract.py to see how contracts can
be deployed, or transactions called.
See pytest/tests/sanity/state_sync.py to see how to delay the launch of the
whole cluster by using init_cluster instead of start_cluster, and then
launching nodes manually.
Enabling adversarial behavior
To allow testing adversarial behavior, or generally, behaviors that a node should
not normally exercise, we have certain features in the code decorated with
#[cfg(feature="adversarial")]. The binary normally is compiled with the
feature disabled, and when compiled with the feature enabled, it traces a
warning on launch.
The nightly runner runs all the python tests against the binary compiled with the feature enabled, and thus the python tests can make the binary perform actions that it normally would not perform.
The actions can include lying about the known chain height, producing multiple blocks for the same height, or disabling doomslug.
See all the tests under pytest/tests/adversarial for some examples.
Python Tests
To simplify writing integration tests for nearcore we have a python infrastructure that allows writing a large variety of tests that run small local clusters, remove clusters, or run against full-scale live deployments.
Such tests are written in python and not in Rust (in which the nearcore itself, and most of the sanity and fuzz tests, are written) due to the availability of libraries to easily connect to, remove nodes and orchestrate cloud instances.
Nearcore itself has several features guarded by a feature flag that allows the python tests to invoke behaviors otherwise impossible to be exercised by an honest actor.
Basics
The infrastructure is located in {nearcore}/pytest/lib and the tests themselves
are in subdirectories of {nearcore}/pytest/tests. To prepare the local machine to
run the tests you'd need python3 (python 3.7), and have several dependencies
installed, for which we recommend using virtualenv:
cd pytest
virtualenv .env --python=python3
. .env/bin/activate
pip install -r requirements.txt
The tests are expected to be ran from the pytest dir itself. For example, once
the virtualenv is configured:
cd pytest
. .env/bin/activate
python tests/sanity/block_production.py
This will run the most basic tests that spin up a small cluster locally and wait until it produces several blocks.
Compiling the client for tests
The local tests by default expect the binary to be in the default location for a
debug build ({nearcore}/target/debug). Some tests might also expect
test-specific features guarded by a feature flag to be available. To compile the
binary with such features run:
cargo build -p neard --features=adversarial
The feature is called adversarial to highlight that the many functions it enables,
outside of tests, would constitute malicious behavior. The node compiled with
such a flag will not start unless an environment variable ADVERSARY_CONSENT=1
is set and prints a noticeable warning when it starts, thus minimizing the chance
that an honest participant accidentally launches a node compiled with such
functionality.
You can change the way the tests run (locally or using Google Cloud), and where the local tests look for the binary by supplying a config file. For example, if you want to run tests against a release build, you can create a file with the following config:
{"local": true, "near_root": "../target/release/"}
and run the test with the following command:
NEAR_PYTEST_CONFIG=<path to config> python tests/sanity/block_production.py
Writing tests
We differentiate between "regular" tests, or tests that spin up their cluster, either local or on the cloud, and "mocknet" tests, or tests that run against an existing live deployment of NEAR.
In both cases, the test starts by importing the infrastructure and starting or connecting to a cluster
Starting a cluster
In the simplest case a regular test starts by starting a cluster. The cluster will run locally by default but can be spun up on the cloud by supplying the corresponding config.
import sys
sys.path.append('lib')
from cluster import start_cluster
nodes = start_cluster(4, 0, 4, None, [["epoch_length", 10], ["block_producer_kickout_threshold", 80]], {})
In the example above the first three parameters are num_validating_nodes,
num_observers and num_shards. The third parameter is a config, which generally
should be None, in which case the config is picked up from the environment
variable as shown above.
start_cluster will spin up num_validating_nodes nodes that are block
producers (with pre-staked tokens), num_observers non-validating nodes and
will configure the system to have num_shards shards. The fifth argument
changes the genesis config. Each element is a list of some length n where the
first n-1 elements are a path in the genesis JSON file, and the last element
is the value. You'd often want to significantly reduce the epoch length, so that
your test triggers epoch switches, and reduce the kick-out threshold since with
shorter epochs it is easier for a block producer to get kicked out.
The last parameter is a dictionary from the node ordinal to changes to their local config.
Note that start_cluster spins up all the nodes right away. Some tests (e.g.
tests that test syncing) might want to configure the nodes but delay their
start. In such a case you will initialize the cluster by calling
init_cluster and will run the nodes manually, for example, see
state_sync.py
Connecting to a mocknet
Nodes that run against a mocknet would connect to an existing cluster instead of running their own.
import sys
sys.path.append('lib')
from cluster import connect_to_mocknet
nodes, accounts = connect_to_mocknet(None)
The only parameter is a config, with None meaning to use the config from the
environment variable. The config should have the following format:
{
"nodes": [
{"ip": "(some_ip)", "port": 3030},
{"ip": "(some_ip)", "port": 3030},
{"ip": "(some_ip)", "port": 3030},
{"ip": "(some_ip)", "port": 3030}
],
"accounts": [
{"account_id": "node1", "pk": "ed25519:<public key>", "sk": "edd25519:<secret key>"},
{"account_id": "node2", "pk": "ed25519:<public key>", "sk": "edd25519:<secret key>"}
]
}
Manipulating nodes
The nodes returned by start_cluster and init_cluster have certain
convenience functions. You can see the full interface in
{nearcore}/pytest/lib/cluster.py.
start(boot_public_key, (boot_ip, boot_port)) starts the node. If both
arguments are None, the node will start as a boot node (note that the concept
of a "boot node" is relatively vague in a decentralized system, and from the
perspective of the tests the only requirement is that the graph of "node A
booted from node B" is connected).
The particular way to get the boot_ip and boot_port when launching node1
with node2 being its boot node is the following:
node1.start(node2.node_key.pk, node2.addr())
kill() shuts down the node by sending it SIGKILL
reset_data() cleans up the data dir, which could be handy between the calls to
kill and start to see if a node can start from a clean state.
Nodes on the mocknet do not expose start, kill and reset_data.
Issuing RPC calls
Nodes in both regular and mocknet tests expose an interface to issue RPC calls.
In the most generic case, one can just issue raw JSON RPC calls by calling the
json_rpc method:
validator_info = nodes[0].json_rpc('validators', [<some block_hash>])
For the most popular calls, there are convenience functions:
send_txsends a signed transaction asynchronouslysend_tx_and_waitsends a signed transaction synchronouslyget_statusreturns the current status (the output of the/status/endpoint), which contains e.g. last block hash and heightget_txreturns a transaction by the transaction hash and the recipient ID.
See all the methods in {nearcore}/pytest/lib/cluster.rs after the definition
of the json_rpc method.
Signing and sending transactions
There are two ways to send a transaction. A synchronous way (send_tx_and_wait)
sends a tx and blocks the test execution until either the TX is finished, or the
timeout is hit. An asynchronous way (send_tx + get_tx) sends a TX and then
verifies its result later. Here's an end-to-end example of sending a
transaction:
# the tx needs to include one of the recent hashes
last_block_hash = nodes[0].get_status()['sync_info']['latest_block_hash']
last_block_hash_decoded = base58.b58decode(last_block_hash.encode('utf8'))
# sign the actual transaction
# `fr` and `to` in this case are instances of class `Key`.
# In mocknet tests the list `Key`s for all the accounts are returned by `connect_to_mocknet`
# In regular tests each node is associated with a single account, and its key is stored in the
# `signer_key` field (e.g. `nodes[0].signer_key`)
# `15` in the example below is the nonce. Nonces needs to increase for consecutive transactions
# for the same sender account.
tx = sign_payment_tx(fr, to.account_id, 100, 15, last_block_hash_decoded)
# Sending the transaction synchronously. `10` is the timeout in seconds. If after 10 seconds the
# outcome is not ready, throws an exception
if want_sync:
outcome = nodes[0].send_tx_and_wait(tx, 10)
# Sending the transaction asynchronously.
if want_async:
tx_hash = nodes[from_ordinal % len(nodes)].send_tx(tx)['result']
# and then sometime later fetch the result...
resp = nodes[0].get_tx(tx_hash, to.account_id, timeout=1)
# and see if the tx has finished
finished = 'result' in resp and 'receipts_outcome' in resp['result'] and len(resp['result']['receipts_outcome']) > 0
See rpc_tx_forwarding.py for an example of signing and submitting a transaction.
Adversarial behavior
Some tests need certain nodes in the cluster to exercise behavior that is impossible to be invoked by an honest node. For such tests, we provide functionality that is protected by an "adversarial" feature flag.
It's an advanced feature, and more thorough documentation is a TODO. Most of the
tests that depend on the feature flag enabled are under
{nearcore}/pytest/tests/adversarial, refer to them for how such features can
be used. Search for code in the nearcore codebase guarded by the "adversarial"
feature flag for an example of how such features are added and exposed.
Interfering with the network
We have a library that allows running a proxy in front of each node that would
intercept all the messages between nodes, deserialize them in python and run a
handler on each one. The handler can then either let the message pass (return True), drop it (return False) or replace it (return <new message>).
This technique can be used to both interfere with the network (by dropping or
replacing messages), and to inspect messages that flow through the network
without interfering with them. For the latter, note that the handler for each node
runs in a separate Process, and thus you need to use multiprocessing
primitives if you want the handlers to exchange information with the main test
process, or between each other.
See the tests that match tests/sanity/proxy_*.py for examples.
Contributing tests
We always welcome new tests, especially python tests that use the above infrastructure. We have a list of test requests here, but also welcome any other tests that test aspects of the network we haven't thought about.
Cheat sheet/overview of testing utils
This page covers the different testing utils/libraries that we have for easier unit testing in Rust.
Basics
CryptoHash
To create a new crypto hash:
#![allow(unused)] fn main() { "ADns6sqVyFLRZbSMCGdzUiUPaDDtjTmKCWzR8HxWsfDU".parse().unwrap(); }
Account
Also, prefer doing parse + unwrap:
#![allow(unused)] fn main() { let alice: AccountId = "alice.near".parse().unwrap(); }
Signatures
In memory signer (generates the key based on a seed). There is a slight preference to use the seed that is matching the account name.
This will create a signer for account 'test' using 'test' as a seed.
#![allow(unused)] fn main() { let signer: InMemoryValidatorSigner = create_test_signer("test"); }
Block
Use TestBlockBuilder to create the block that you need. This class allows you to set custom values for most of the fields.
#![allow(unused)] fn main() { let test_block = test_utils::TestBlockBuilder::new(prev, signer).height(33).build(); }
Store
Use the in-memory test store in tests:
#![allow(unused)] fn main() { let store = create_test_store(); }
EpochManager
Use EpochManager itself.
Runtime
Use Nightshade runtime.
Chain
No fakes or mocks.
Client
TestEnv - for testing multiple clients (without network):
#![allow(unused)] fn main() { TestEnvBuilder::new(genesis).client(vec!["aa"]).validators(..).epoch_managers(..).build(); }
Network
PeerManager
To create a PeerManager handler:
#![allow(unused)] fn main() { let pm = peer_manager::testonly::start(...).await; }
To connect to others:
#![allow(unused)] fn main() { pm.connect_to(&pm2.peer_info).await; }
Events handling
To wait/handle a given event (as a lot of network code is running in an async fashion):
#![allow(unused)] fn main() { pm.events.recv_util(|event| match event {...}).await; }
End to End
chain, runtime, signer
In chain/chain/src/test_utils.rs:
#![allow(unused)] fn main() { // Creates 1-validator (test): chain, KVRuntime and a signer let (chain, runtime, signer) = setup(); }
block, client actor, view client
In chain/client/src/test_utils.rs
#![allow(unused)] fn main() { let (block, client, view_client) = setup(MANY_FIELDS); }
Test Coverage
In order to focus the testing effort where it is most needed, we have a few ways we track test coverage.
Codecov
The main one is Codecov. Coverage is visible on this webpage, and displays the total coverage, including unit and integration tests. Codecov is especially interesting for its PR comments. The PR comments, in particular, can easily show which diff lines are being tested and which are not.
However, sometimes Codecov gives too rough estimates, and this is where artifact results come in.
Artifact Results
We also push artifacts, as a result of each CI run. You can access them here:
- Click "Details" on one of the CI actions run on your PR (literally any one of the actions is fine, you can also access CI actions runs on any CI)
- Click "Summary" on the top left of the opening page
- Scroll to the bottom of the page
- In the "Artifacts" section, just above the "Summary" section, there is a
coverage-htmllink (there is alsocoverage-lcovfor people who use eg. the coverage gutters vscode integration) - Downloading it will give you a zip file with the interesting files.
In there, you can find:
- Two
-difffiles, that contain code coverage for the diff of your PR, to easily see exactly which lines are covered and which are not - Two
-fullfolders, that contain code coverage for the whole repository - Each of these exists in one
unit-variant, that only contains the unit tests, and oneintegration-variant, that contains all the tests we currently have
To check that your PR is properly tested, if you want better quality
coverage than what codecov "requires," you can have a look at unit-diff,
because we agreed that we want unit tests to be able to detect most bugs
due to the troubles of debugging failing integration tests.
To find a place that would deserve adding more tests, look at one of the
-full directories on master, pick one not-well-tested file, and add (ideally
unit) tests for the lines that are missing.
The presentation is unfortunately less easy to access than codecov, and less
eye-catchy. On the other hand, it should be more precise. In particular, the
-full variants show region-based coverage. It can tell you that eg. the ?
branch is not covered properly by highlighting it red.
One caveat to be aware of: the -full variants do not highlight covered lines
in green, they just highlight non-covered lines in red.
Protocol Upgrade
This document describes the entire cycle of how a protocol upgrade is done, from the initial PR to the final release. It is important for everyone who contributes to the development of the protocol and its client(s) to understand this process.
Background
At NEAR, we use the term protocol version to mean the version of the blockchain protocol and is separate from the version of some specific client (such as nearcore), since the protocol version defines the protocol rather than some specific implementation of the protocol. More concretely, for each epoch, there is a corresponding protocol version that is agreed upon by validators through a voting mechanism. Our upgrade scheme dictates that protocol version X is backward compatible with protocol version X-1 so that nodes in the network can seamlessly upgrade to the new protocol. However, there is no guarantee that protocol version X is backward compatible with protocol version X-2.
Despite the upgrade mechanism, rolling out a protocol change can be scary, especially if the change is invasive. For those changes, we may want to have several months of testing before we are confident that the change itself works and that it doesn't break other parts of the system.
Protocol version voting and upgrade
When a new neard version, containing a new protocol version, is released, all node maintainers need to upgrade their binary. That typically means stopping neard, downloading or compiling the new neard binary and restarting neard. However the protocol version of the whole network is not immediately bumped to the new protocol version. Instead a process called voting takes place and determines if and when the protocol version upgrade will take place.
Voting is a fully automated process in which all block producers across the network vote in support or against upgrading the protocol version. The voting happens in the last block every epoch. Upgraded nodes will begin voting in favour of the new protocol version after a predetermined date. The voting date is configured by the release owner like this. Once at least 80% of the stake votes in favour of the protocol change in the last block of epoch X, the protocol version will be upgraded in the first block of epoch X+2.
For mainnet releases, the release on github typically happens on a Monday or Tuesday, the voting typically happens a week later and the protocol version upgrade happens 1-2 epochs after the voting. This gives the node maintainers enough time to upgrade their neard nodes. The node maintainers can upgrade their nodes at any time between the release and the voting but it is recommended to upgrade soon after the release. This is to accommodate for any database migrations or miscellaneous delays.
Starting a neard node with protocol version voting in the future in a network that is already operating at that protocol version is supported as well. This is useful in the scenario where there is a mainnet security release where mainnet has not yet voted or upgraded to the new version. That same binary with protocol voting date in the future can be released in testnet even though it has already upgraded to the new protocol version.
Nightly Protocol features
To make protocol upgrades more robust, we introduce the concept of a nightly
protocol version together with the protocol feature flags to allow easy testing
of the cutting-edge protocol changes without jeopardizing the stability of the
codebase overall. The use of the nightly feature for new protocol features
is mandatory while the use of dedicated rust features for new protocol features
is optional and only recommended when necessary. Adding rust features leads to
conditional compilation which is generally not developer friendly. In Cargo.toml
file of the crates we have in nearcore, we introduce the rust compile-time feature
nightly:
nightly = [
...
]
where nightly is a collection of new protocol features that indicates we are using
the nightly protocol version.
When it is not necessary to use a rust feature for the new protocol feature the Cargo.toml file will remain unchanged.
When it is necessary to use a rust feature for the new protocol feature, it can be added to the Cargo.toml, to the nightly features. For example, when we introduce EVM as a new protocol change, suppose the current protocol version is 40, then we would do the following change in Cargo.toml:
nightly = [
"protocol_features_evm",
...
]
In core/primitives-core/src/version.rs, we would change the protocol version by:
#![allow(unused)] fn main() { pub const PROTOCOL_VERSION: ProtocolVersion = if cfg!(feature = "nightly") { NIGHTLY_PROTOCOL_VERSION } else { STABLE_PROTOCOL_VERSION }; }
This way the stable versions remain unaffected after the change. Note that nightly protocol version intentionally starts at a much higher number to make the distinction between the stable protocol and nightly protocol clearer.
To determine whether a protocol feature is enabled, we do the following:
- We maintain a
ProtocolFeatureenum where each variant corresponds to some protocol feature. For nightly protocol features, the variant may optionally be gated by the corresponding rust compile-time feature. - We implement a function
protocol_versionto return, for each variant, the corresponding protocol version in which the feature is enabled. - When we need to decide whether to use the new feature based on the protocol
version of the current network, we can simply compare it to the protocol
version of the feature. To make this simpler, we also introduced a macro
checked_feature
For more details, please refer to core/primitives/src/version.rs.
Feature Gating
It is worth mentioning that there are two types of checks related to protocol features:
- Runtime checks that compare the protocol version of the current epoch and the protocol version of the feature. Those runtime checks must be used for both stable and nightly features.
- Compile time checks that check if the rust feature corresponding with the protocol feature is enabled. This check is optional and can only be used for nightly features.
Testing
Nightly protocol features allow us to enable the most bleeding-edge code in some testing environments. We can choose to enable all nightly protocol features by
#![allow(unused)] fn main() { cargo build -p neard --release --features nightly }
or enable some specific protocol feature by
#![allow(unused)] fn main() { cargo build -p neard --release --features nightly,<protocol_feature> }
In practice, we have all nightly protocol features enabled for Nayduck tests and on betanet, which is updated daily.
Feature Stabilization
New protocol features are introduced first as nightly features and when the
author of the feature thinks that the feature is ready to be stabilized, they
should submit a pull request to stabilize the feature using
this template.
In this pull request, they should do the feature gating, increase the
PROTOCOL_VERSION constant (if it hasn't been increased since the last
release), and change the protocol_version implementation to map the
stabilized features to the new protocol version.
A feature stabilization request must be approved by at least two nearcore code owners. Unless it is a security-related fix, a protocol feature cannot be included in any release until at least one week after its stabilization. This is to ensure that feature implementation and stabilization are not rushed.
Release tracker issue
Every published release opens or updates a "release tracker" GitHub issue that
lists the commits present on the release tag but not on master. This closes
the gap where cherry-picked vulnerability fixes go into a release branch first
and never make it back to master, causing regressions on the next release.
The tracker is maintained by .github/workflows/neard_release.yml via
scripts/track_release_commits.py. It runs on every release: published
event:
- Scope by master base. All patch releases cut from the same point on
master (e.g. 2.10.0, 2.10.1, 2.10.2, …) share a single tracker issue,
keyed by
git merge-base origin/master <tag>. A new minor release cut from a later master opens a new issue. Local invocations against a fork can override the master ref with--master-ref upstream/master. - Auto-checking. Commits whose patch is already on master (as detected
by
git cherry -v, which uses patch-ids) are pre-checked[x]. Only the[ ]entries need release-owner attention. - Reopen on new release. A closed tracker is automatically reopened when a new release is cut from the same master base, in case there are new commits to review.
What release owners should do. For each unchecked item, either:
- merge the corresponding change into
mastervia a PR and tick the box once the PR lands, or - tick the box and briefly note why the commit doesn't belong on master (e.g. "version bump", "voting date", "release-only workaround").
Once every box is ticked, close the issue. If another patch release is cut from the same base afterwards, the workflow will reopen it automatically.
This document describes the advanced network options that you can configure by modifying the "network" section of your "config.json" file:
{
// ...
"network": {
// ...
"public_addrs": [],
"allow_private_ip_in_public_addrs": false,
"experimental": {
"inbound_disabled": false,
"connect_only_to_boot_nodes": false,
"skip_sending_tombstones_seconds": 0,
"tier1_enable_inbound": true,
"tier1_enable_outbound": false,
"tier1_connect_interval": {
"secs": 60,
"nanos": 0
},
"tier1_new_connections_per_attempt": 50
}
},
// ...
}
TIER1 network
Participants of the BFT consensus (block & chunk producers) now can establish direct (aka TIER1) connections between each other, which will optimize the communication latency and minimize the number of dropped chunks. If you are a validator, you can enable TIER1 connections by setting the following fields in the config:
- public_addrs
- this is a list of the public addresses (in the format
"<node public key>@<IP>:<port>") of trusted nodes, which are willing to route messages to your node - this list will be broadcasted to the network so that other validator nodes can connect to your node.
- if your node has a static public IP, set
public_addrsto a list with a single entry with the public key and address of your node, for example:"public_addrs": ["ed25519:86EtEy7epneKyrcJwSWP7zsisTkfDRH5CFVszt4qiQYw@31.192.22.209:24567"]. - if your node doesn't have a public IP (for example, it is hidden behind a NAT), set
public_addrsto a list (<=10 entries) of proxy nodes that you trust (arbitrary nodes with static public IPs). - support for nodes with dynamic public IPs is not implemented yet.
- this is a list of the public addresses (in the format
- experimental.tier1_enable_outbound
- makes your node actively try to establish outbound TIER1 connections (recommended) once it learns about the public addresses of other validator nodes. If disabled, your node won't try to establish outbound TIER1 connections, but it still may accept incoming TIER1 connections from other nodes.
- currently
falseby default, but will be changed totrueby default in the future
- experimental.tier1_enable_inbound
- makes your node accept inbound TIER1 connections from other validator nodes.
- disable both
tier1_enable_inboundandtier1_enable_outboundif you want to opt-out from the TIER1 communication entirely - disable
tier1_enable_inboundif you are not a validator AND you don't want your node to act as a proxy for validators. trueby default
Forknet Scenario Tool
The forknet_scenario.py script is used to run test scenarios.
Prerequisites
- GCP access (SRE)
- Infra-ops access (SRE)
- Install gcloud tools locally link
- Understand the basics of forknet from mirror
Usage
- Go to
pytestdirectory. - Create the nodes:
python tests/mocknet/forknet_scenario.py --unique-id UNIQUE-ID --test-case Example create
- Start the test
python tests/mocknet/forknet_scenario.py --unique-id token --test-case Example start --neard-upgrade-binary-url $NEARD_UPGRADE_BINARY_URL
- Stop the test and free the nodes
python tests/mocknet/forknet_scenario.py --unique-id token --test-case Example destroy
Adding testcase
The test case functions will be executed sequentially in the order defined in forknet_scenario.py. To add a new test scenario:
-
Create a new class in
tests/mocknet/forknet_scenarios/that inherits fromTestSetupbase class -
Define required parameters in
__init__:def __init__(self, args): super().__init__(args) # Required parameters: self.start_height = 123456789 # Forknet image height self.args.start_height = self.start_height self.node_hardware_config = NodeHardware.SameConfig( num_chunk_producer_seats=19, # Number of block producers and chunk producers num_chunk_validator_seats=24, # Total number of validator nodes in the network. ) self.epoch_len = 18000 # Epoch length in blocks self.genesis_protocol_version = 77 # Protocol version # Optional parameters: self.has_archival = True # Enable archival nodes self.has_state_dumper = False # Enable state dumper self.regions = None # List of GCP regions, None for default # Set base binary URL for initial network state self.neard_binary_url = 'https://...' -
Override methods to customize behavior:
before_test_setup()- Run commands before test creationamend_configs_before_test_start()- Modify node configs before startafter_test_start()- Run commands after test starts
-
Scenario building blocks
For more complex actions, you need to define the behaviour by scheduling actions using run-cmd in the mirror lib.
As a rule of thumb, if the run-cmd is too long, consider uploading it as a helper script. (see send-stake-proposal.sh)
Some of the functions are already defined in base.py and can be used in your after_test_start() override.
_schedule_upgrade_nodes_every_n_minutes: for a uniform upgrade._schedule_binary_upgrade: if you want more granular control over how the hosts are upgraded._send_stake_proposal: if you need to stake or unstake validators.
Mirror Guide
Prerequisites
- GCP access (SRE)
- Infra-ops access (SRE)
- Install gcloud tools locally link
Creating the infrastructure
Running terraform apply take about 10 minutes, depending on how many hosts you need.
To setup the GCP hosts that you want to use in your mocknet, you need to create a Terraform recipe.
Start in Infra-ops repo, in infra-ops/provisioning/terraform/infra/network/mocknet folder (link). Make a copy of example-forknet folder.
Find the forknet image that you are going to use in your test by running sh mirror-base/util.sh ls-test-cases. If you are not sure, use the latest START_HEIGHT.
In your newly created folder, edit the main.tf file:
- unique_id: You will identify your forknet by this string. i.e.
my-test, but not too long. GCP has a limit on names. - start_height:
START_HEIGHT# the number from above - state_dumper : true/false # When set to
true, it creates the infrastructure needed for state sync, including a state part dumper and state parts bucket. If you don't plan to have your nodes change tracked shards, keep itfalse. - nodes_location : here you add your nodes in different locations. Only use these locations .
- tracing_server: If you want to gather traces on a dedicated server.
- machine_type : Depending on your need "n2d-standard-16" has 64GB RAM while"n2d-standard-8" has 32GB.
Edit resources.tf:
-
Set prefix = "state/infra/network/mocknet/unique_id-start_height"
This is to allow other people to modify this network by pushing the state file to a gcp bucket
Once you have these files run terraform init, terraform apply (make sure to run these commands from the newly created directory, not from mocknet directory), and push your changes to a branch in the repo. This will allow others to amend / delete this network.
To save resources, destroy the infrastructure if you do not use it. You can do this with terraform destroy
Configure the nodes
To configure and operate the nodes we use the mirror.py script from nearcore repo.
Alias
Create an alias to the mirror.py tool with to make the commands shorter by replacing YOUR_ID and YOUR_START_HEIGHT with the values set in terraform.
alias mirror="python3 tests/mocknet/mirror.py --chain-id mainnet --start-height YOUR_START_HEIGHT --unique-id YOUR_ID"
All mirror commands should be run from the nearcore/pytest directory, otherwise relative directories will break.
Binary
Get a link to the binary that you want to test:
NODE_BINARY_URL=https://s3-us-west-1.amazonaws.com/build.nearprotocol.com/nearcore/Linux/master/neard
Initialize the testing environment
This will upload the orchestrator (`neard-runner`) to all the hosts and create the necessary folders:
mirror init-neard-runner --neard-binary-url $NODE_BINARY_URL --neard-upgrade-binary-url ""
[Optional] genesis configs
Reduce the min gas price to reduce the chance of running out of NEAR.
mirror --host-type traffic run-cmd --cmd 'cp ~/.near/target/setup/genesis.json g.json ; jq ".min_gas_price = \"10000000\"" g.json > ~/.near/target/setup/genesis.json'
mirror --host-type nodes run-cmd --cmd 'cp ~/.near/setup/genesis.json g.json ; jq ".min_gas_price = \"10000000\"" g.json > ~/.near/setup/genesis.json'
Create the a new test
mirror new-test \
--epoch-length 200 \
--genesis-protocol-version 71 \
--num-validators 20 \
--num-seats 20 \
--new-chain-id mocknet \
--gcs-state-sync
--epoch-length If you need state sync, allow at least 5500.
--genesis-protocol-version Can be 1 less than the binary version. If you want to do 2 upgrades, you need to set a voting schedule in an ENV variable.
--num-validators 20 How many of your GCP hosts you want to be added to the validator pool in genesis.
--num-seats 20 How many block producers do you want in your network. (WIP. Currently a dummy parameter)
--new-chain-id mocknet Set the name of your chain id in genesis. Do not use mainnet or testnet. Typical value for this argument is mocknet. The chain_id in the grafana metrics is not set by this value, it is set by a value in terraform file. chain_id in metrics is always set to mocknet.
--gcs-state-sync If you want to benefit from state sync, your nodes will be configured to sync from the bucket dedicated to your mocknet. You need to enable state_dumper in terraform.
First time you run new-test it will take less than 1 minute for the nodes to be ready. Check the status with mirror status. If you run new-test on an existing network the process will take slightly longer because it needs to delete the existing data folder (2-3 minutes).
[Optional] Custom shard tracking
If you need to set full shard tracking on any node, you can change the configs like this:
mirror --host-filter "<nodes regex>" update-config --set 'store.load_mem_tries_for_tracked_shards=false,tracked_shards=[0]'
[Optional] Set logs
Note that RUST_LOGs are controlled by log_config.json.
RUST_LOG="debug,network=info"
mirror --host-type nodes run-cmd --cmd "jq '.opentelemetry = \"${RUST_LOG}\" | .rust_log = \"${RUST_LOG}\"' /home/ubuntu/.near/log_config.json > tmp && mv tmp /home/ubuntu/.near/log_config.json"
mirror --host-type traffic run-cmd --cmd "jq '.opentelemetry = \"${RUST_LOG}\" | .rust_log = \"${RUST_LOG}\"' /home/ubuntu/.near/target/log_config.json > tmp && mv tmp /home/ubuntu/.near/target/log_config.json"
[Optional] Set tracing server
UNIQUE_ID=your unique id
SEARCH_STRING="$UNIQUE_ID-tracing"
SERVER_IP=$(gcloud compute instances list --project=nearone-mocknet | awk -v search="$SEARCH_STRING" '$0 ~ search {print $5}')
mirror env --key-value "OTEL_EXPORTER_OTLP_TRACES_ENDPOINT=http://$SERVER_IP:4317"
Operating the network
Start the network
# Check if is ready with mirror status
# Start nodes with traffic
mirror start-traffic
# Or start without traffic
mirror start-nodes
Stop the network
# Stop all nodes and traffic
mirror stop-nodes
# Stop traffic
mirror stop-traffic
Reset the network
mirror stop-nodes
mirror reset --backup-id start --yes
Update the binary
Stop the nodes before altering the running binary.
If you are using the same URL: make a new build and run update-binaries:
update-binaries Update the neard binaries by re-downloading them. The same urls are used. If you plan to restart the network multiple times, it is recommended to use URLs that only depend on the branch name. This way, every time you
build, you will not need to amend the URL but just run update-binaries.
If you plan to use a binary from another branch, you need to alter the URL with amend-binaries:
amend-binaries Add or override the neard URLs by specifying the epoch height or index if you have multiple binaries. If the network was started with 2 binaries, the epoch height for the second binary can be randomly assigned on each
host. Use caution when updating --epoch-height so that it will not add a binary in between the upgrade window for another binary.
URL=https://s3-us-west-1.amazonaws.com/build.nearprotocol.com/nearcore/Linux/some_branch/neard
mirror amend-binaries --neard-binary-url $URL --binary-idx 0
The following option is not recommended, but, if the binary isn't available at a public URL, but you have it on your machine/laptop, you can upload it like:gcloud --project near-mocknet compute scp {local_neard_path} ubuntu@{instance_name}:/home/ubuntu/.near/neard-runner/binaries/neard0
Run commands on the nodes
mirror run-cmd --cmd "cat .near/neard-runner/.env"
Target specific hosts
There are three selectors that can be combined
--host-type {all,nodes,traffic}
Type of hosts to select
--host-filter HOST_FILTER
Filter through the selected nodes using regex.
--select-partition SELECT_PARTITION
Input should be in the form of "i/n" where 0 < i <= n. Select a group of hosts based on the division provided. For i/n, it will split the selected hosts into n groups and select the i-th group. Use this if you want to
target just a partition of the hosts.
Get mapped account data
In Forknet, all accounts are set up with a full-access key, allowing full control over all transactions made by those accounts. To retrieve this injected key, you can use the neard mirror show-keys tool on any mainnet database. This can be done using either a local database copy or an accessible RPC endpoint. This setup is useful for testing purposes since having a full-access key on all accounts enables precise control over transactions and allows for easy testing and debugging across network simulations.
neard mirror show-keys from-rpc --account-id "astro-stakers.poolv1.near" --rpc-url https://rpc.mainnet.near.org/
If it exists, this account probably has an extra full access key added:
mapped secret key: ed25519:5GnmuWueJptLxKYoirp6rHHDJpu7vLgM1BCXwfvc8CJ8cmoettg9vYVaN2mqJZPbiRcrqFuPb7AXjf2jCJyVpyNQ
public key: ed25519:93zQfXQsfWEkDG2n5qKfbTQUxLZdMrvGpBtwpezWpWTJ
Check the logs
To get the logs of the neard_runner.py and see what commands were executed on the host during setup or operation, look at the journalctl -ru neard-runner
To check the neard logs look at the files in ~/neard-logs/logs.txt. This file is rotated so it does not become too big.
Overview
This chapter holds various assorted bits of docs. If you want to document something, but don't know where to put it, put it here!
Crate Versioning and Publishing
While all the crates in the workspace are directly unversioned (v0.0.0), they
all share a unified variable version in the workspace manifest.
This keeps versions consistent across the workspace and informs their versions
at the moment of publishing.
We also have CI infrastructure set up to automate the publishing process to
crates.io. So, on every merge to master, if there's a version change, it is
automatically applied to all the crates in the workspace and it attempts to
publish the new versions of all non-private crates. All crates that should be
exempt from this process should be marked private. That is, they should have
the publish = false specification in their package manifest.
This process is managed by cargo-workspaces, with a bit of magic sprinkled on top.
Issue Labels
Issue labels are of the following format <type>-<content> where <type> is a
capital letter indicating the type of the label and <content> is a hyphened
phrase indicating what this label is about. For example, in the label C-bug,
C means category and bug means that the label is about bugs. Common types
include C, which means category, A, which means area and T, which means team.
An issue can have multiple labels including which area it touches, which team
should be responsible for the issue, and so on. Each issue should have at least
one label attached to it after it is triaged and the label could be a general
one, such as C-enhancement or C-bug.
Dump State to External Storage
Purpose
A node can dump the state of every epoch to external storage. The following kinds of external storage are supported:
- Local filesystem
- Google Cloud Storage
- Amazon S3
Note: consuming state parts from external storage (centralized state sync) has been removed — nodes now always sync state from peers (State Sync). Only the dump side documented here remains, for archival and state-distribution tooling.
How-to
To manage your own dumps of state, keep reading.
Google Cloud Storage
To enable Google Cloud Storage as your external storage, add this to your
config.json file:
"state_sync": {
"dump": {
"location": {
"GCS": {
"bucket": "my-gcs-bucket",
}
}
}
}
And run your node with an environment variable SERVICE_ACCOUNT or
GOOGLE_APPLICATION_CREDENTIALS pointing to the credentials json file
SERVICE_ACCOUNT=/path/to/file ./neard run
Amazon S3
To enable Amazon S3 as your external storage, add this to your config.json
file:
"state_sync": {
"dump": {
"location": {
"S3": {
"bucket": "my-aws-bucket",
"region": "my-aws-region"
}
}
}
}
And run your node with environment variables AWS_ACCESS_KEY_ID and
AWS_SECRET_ACCESS_KEY:
AWS_ACCESS_KEY_ID="MY_ACCESS_KEY" AWS_SECRET_ACCESS_KEY="MY_AWS_SECRET_ACCESS_KEY" ./neard run
Dump to a local filesystem
Add this to your config.json file to dump state of every epoch to local
filesystem:
"state_sync": {
"dump": {
"location": {
"Filesystem": {
"root_dir": "/tmp/state-dump"
}
}
}
}
In this case you don't need any extra environment variables. Simply run your node:
./neard run
Archival node - Recovery of missing data
Incident description
In early 2024 there have been a few incidents on archival node storage. As result of these incidents archival node might have lost some data from January to March.
The practical effect of this issue is that requests querying the state of an account may fail, returning instead an internal server error.
Check if my node has been impacted
The simplest way to check whether or not a node has suffered data loss is to run one of the following queries:
replace <RPC_URL> with the correct URL (example: http://localhost:3030)
curl -X POST <RPC_URL> \
-H "Content-Type: application/json" \
-d '
{ "id": "dontcare", "jsonrpc": "2.0", "method": "query", "params": { "account_id": "b001b461c65aca5968a0afab3302a5387d128178c99ff5b2592796963407560a", "block_id": 109913260, "request_type": "view_account" } }'
curl -X POST <RPC_URL> \
-H "Content-Type: application/json" \
-d '
{ "id": "dontcare", "jsonrpc": "2.0", "method": "query", "params": { "account_id": "token2.near", "block_id": 114580308, "request_type": "view_account" } }'
curl -X POST <RPC_URL> \
-H "Content-Type: application/json" \
-d '
{ "id": "dontcare", "jsonrpc": "2.0", "method": "query", "params": { "account_id": "timpanic.tg", "block_id": 115185110, "request_type": "view_account" } }'
curl -X POST <RPC_URL> \
-H "Content-Type: application/json" \
-d '
{ "id": "dontcare", "jsonrpc": "2.0", "method": "query", "params": { "account_id": "01.near", "block_id": 115514400, "request_type": "view_account" } }'
If for any of the above requests you get an error of the kind MissingTrieValue it means that the node presents the issue.
Remediation steps
Option A (recommended): download a new DB snapshot
-
Stop
neard -
Delete the existing
hotandcolddatabases. Example assuming default configuration:rm -rf ~/.near/hot-data && rm -rf ~/.near/cold-data -
Download an up-to-date snapshot, following this guide: Storage snapshots
Option B: manually run recovery commands
Follow the instructions below if, for any reason, you prefer to perform the manual recovery steps on your node instead of downloading a new snapshot.
Requirements:
neardmust be stopped while recovering datacoldstorage must be mounted on an SSD disk or better- The config
resharding_config.batch_delaymust be set to 0.
After the recovery is finished the configuration changes can be undone and a hard disk drive can be used to mount the cold storage.
Important considerations:
- The recovery procedure will, most likely, take more than one week
- Since
neardmust be stopped in order to execute the commands, the node won't be functional during this period of time
- Since
- The node must catch up to the chain's head after completing the data recovery, this could take days as well
- During catch up the node can answer RPC queries. However, the chain head is still at the point where the node was stopped; for this reason recent blocks won't be available immediately
We published a reference recovery script in the nearcore repository. Your neard setup might be different, so the advice is to thoroughly check the script before running it. For completeness, here we include the set of commands to run:
neard view-state -t cold --readwrite apply-range --start-index 109913254 --end-index 110050000 --shard-id 2 --storage trie-free --save-state cold sequential
RUST_LOG=debug neard database resharding --height 114580307 --shard-id 0 --restore
RUST_LOG=debug neard database resharding --height 114580307 --shard-id 1 --restore
RUST_LOG=debug neard database resharding --height 114580307 --shard-id 2 --restore
RUST_LOG=debug neard database resharding --height 114580307 --shard-id 3 --restore
RUST_LOG=debug neard database resharding --height 115185107 --shard-id 0 --restore
RUST_LOG=debug neard database resharding --height 115185107 --shard-id 1 --restore
RUST_LOG=debug neard database resharding --height 115185107 --shard-id 2 --restore
RUST_LOG=debug neard database resharding --height 115185107 --shard-id 3 --restore
RUST_LOG=debug neard database resharding --height 115185107 --shard-id 4 --restore
Verify if remediation has been successful
Run the queries specified in the section: Check if my node has been impacted. All of them should return a successful response now.
Connect Claude Code to grafana.nearone.org
This document sets up the official grafana/mcp-grafana MCP server so Claude Code can query dashboards, Prometheus, Loki, Tempo, alerts, and on-call schedules during incidents and investigations.
First complete the Prerequisites, then ask Claude to follow the instructions. In a Claude Code session say:
Follow the instructions in
docs/grafana-mcp-setup.mdto set up the Grafana MCP server for me.
Claude will run through the steps below, verify each one, and stop with a clear error if anything is off.
Prerequisites (do these yourself — Claude cannot)
1. Get a Grafana service account token
You can obtain the grafana service account token from 1Password. It's stored as
Grafana MCP Token. If the token is missing or doesn't work please reach out to
the SRE team for support.
2. Save the token to a local file
Do this in your own terminal (not in Claude Code's prompt). Either use an editor, or a one-liner with read -rsp — both avoid leaking the token to shell history.
Editor:
mkdir -p ~/.config/grafana
vim -n ~/.config/grafana/nearone-token # -n disables swap files so the token doesn't linger on disk
# paste the token, save and quit
chmod 600 ~/.config/grafana/nearone-token
One-liner:
mkdir -p ~/.config/grafana && \
umask 077 && \
read -rsp "paste Grafana service account token (glsa_...): " TOK && \
printf '%s' "$TOK" > ~/.config/grafana/nearone-token && \
unset TOK && echo && echo saved
Instructions for Claude
Execute the steps below in order. Stop and report to the user if any step fails — do not improvise around errors.
Step 1: Verify prerequisites
Run each check. Abort with the stated message if a check fails.
# Token file present and non-empty
[ -s ~/.config/grafana/nearone-token ] || { echo "ABORT: ~/.config/grafana/nearone-token is missing or empty. See prerequisites."; exit 1; }
# Token file has correct format
grep -q '^glsa_' ~/.config/grafana/nearone-token || {
echo "ABORT: token does not start with glsa_. You likely have an access policy token (glc_...) or a service account login (sa-1-...). See prerequisites section for how to tell them apart.";
exit 1;
}
Step 2: Install uv if missing
uvx is the recommended runtime for the MCP server (single binary, no daemon). Skip if already installed.
if ! command -v uvx >/dev/null && ! [ -x ~/.local/bin/uvx ]; then
curl -LsSf https://astral.sh/uv/install.sh | sh
fi
Verify it's on PATH. If not, the user's shell init hasn't picked up ~/.local/bin yet — tell them to either restart their shell or add export PATH="$HOME/.local/bin:$PATH" to their shell rc.
Step 3: Verify the token actually works
Do this before registering the MCP server. Grafana will return 401 "Invalid API key" on every UI endpoint if the token is wrong, even though the MCP server itself will report ✓ Connected in claude mcp list (the MCP handshake does not exercise the token).
TOKEN=$(cat ~/.config/grafana/nearone-token)
HTTP=$(curl -s -o /dev/null -w "%{http_code}" \
-H "Authorization: Bearer $TOKEN" \
https://grafana.nearone.org/api/user)
if [ "$HTTP" != "200" ]; then
echo "ABORT: token rejected by Grafana (HTTP $HTTP). Token is malformed, expired, revoked, or the wrong type. Re-check the prerequisites."
exit 1
fi
echo "token verified: /api/user returned 200"
unset TOKEN
Step 4: Write the wrapper script
Create ~/.local/bin/mcp-grafana-nearone:
#!/usr/bin/env bash
set -euo pipefail
TOKEN_FILE="${HOME}/.config/grafana/nearone-token"
if [[ ! -r "${TOKEN_FILE}" ]]; then
echo "mcp-grafana-nearone: token file not found at ${TOKEN_FILE}" >&2
exit 1
fi
export GRAFANA_URL="https://grafana.nearone.org"
GRAFANA_SERVICE_ACCOUNT_TOKEN="$(cat "${TOKEN_FILE}")"
export GRAFANA_SERVICE_ACCOUNT_TOKEN
exec uvx --from mcp-grafana mcp-grafana --disable-write "$@"
Then chmod +x ~/.local/bin/mcp-grafana-nearone.
Why --disable-write: this is a read-only deployment. Claude can query, inspect, and render but cannot modify dashboards, alerts, incidents, or annotations. If a teammate needs write access later, they drop the flag in their own wrapper.
Step 5: Register the MCP server with Claude Code
Scope: user (available in every project, not tied to one repo).
# Remove any stale entry so re-runs are clean
claude mcp remove grafana --scope user 2>/dev/null || true
claude mcp add grafana --scope user -- ~/.local/bin/mcp-grafana-nearone
Step 6: Verify the full stack
claude mcp list 2>&1 | grep -A1 grafana
Expect grafana: ... ✓ Connected. If it shows ✗ Failed to connect, run ~/.local/bin/mcp-grafana-nearone </dev/null interactively and report the error to the user.
Step 7: Tell the user what's next
Report to the user, in their words:
Grafana MCP is set up at user scope. Restart Claude Code (exit + relaunch) so the MCP tools register in a new session. Once restarted, you can ask me to query Prometheus, search dashboards, pull logs from Loki, etc.
Token rotation later: overwrite
~/.config/grafana/nearone-tokenwith the new value. No other config changes needed.To uninstall:
claude mcp remove grafana --scope user && rm ~/.local/bin/mcp-grafana-nearone ~/.config/grafana/nearone-token.
Troubleshooting
| Symptom | Likely cause | Fix |
|---|---|---|
claude mcp list shows ✓ Connected but tool calls return "Invalid API key" | Token is glc_... (access policy) or sa-1-... (login ID), not glsa_... | Generate a real service account token; see prerequisites |
claude mcp list shows ✗ Failed to connect | Wrapper script errored before stdio handshake — usually missing token file | cat ~/.config/grafana/nearone-token to confirm presence; run wrapper directly to see error |
uvx: command not found after install | ~/.local/bin not on PATH | export PATH="$HOME/.local/bin:$PATH" in shell rc, restart shell |
401 on /api/user during verification | Token expired, revoked, or wrong org | Regenerate; confirm it's a service account token not an access policy |
| Tools work but empty results on datasource queries | Service account has Viewer role but no datasource-level permissions | Admin needs to grant datasources:query scope or ensure Viewer role is org-wide |
Datasources available on grafana.nearone.org
After setup you can query these directly (UIDs for reference):
- Prometheus (default):
grafanacloud-nearone-prom - Loki:
grafanacloud-nearone-logs - Tempo:
grafanacloud-nearone-traces - Postgres:
telemetry_mainnet,telemetry_testnet,crt_benchmarks - Validator-specific Prometheus:
prom-mainnet-validators,pagoda-prom - Google Cloud Monitoring:
Bridge services,GCP Google stackdriver - Plus
grafana-github-datasource,Synthetic Monitoring,grafanacloud-ml-metrics
Security notes
- The token file is
chmod 600— don't loosen those permissions. - Never paste a token into a Claude Code prompt. Claude Code sends conversation content to Anthropic; anything you type there is no longer purely local. Use the
read -rspflow in the prerequisites. - Rotate tokens if they're exposed (committed to git, pasted in Slack, etc.). Admin revokes the token in Grafana UI; you generate a new one and overwrite the file.
Zulip MCP setup (macOS + Docker Desktop)
A Zulip MCP server for Claude Code that runs in a companion Docker container, so your API key stays isolated — it lives only in the container's process env and your macOS Keychain, never in Claude's conversation context or reachable by Claude's own tools (when Claude runs in a different container).
Know the limits. The companion container is an isolation boundary against Claude-in-a-container, not an encryption vault. Anyone with Docker access on your Mac can trivially extract the key, e.g.:
docker compose exec zulip-mcp env | grep ZULIP_API_KEY
That includes you, anything else you run on your host, and Claude Code if you
run it natively on macOS with docker on PATH. Use a dedicated bot key
(see Prerequisites) so rotation is cheap, and see Security notes
for the full threat model.
Prerequisites
- macOS with Docker Desktop installed and running
- Claude Code CLI installed (
claude --version) - A Zulip API key. Prefer a dedicated bot's key over your personal one —
it bounds blast radius and is easy to rotate.
- Bot key: Zulip → avatar → Personal settings → Bots → Add a new bot (Generic type), then copy its API key. Subscribe the bot to only the streams you want Claude to read.
- Personal key: Zulip → avatar → Personal settings → Account & privacy → "Manage your API key".
One-time setup
1. Clone the repo
git clone https://github.com/VanBarbascu/zulip-mcp.git
cd zulip-mcp
2. Store your API key in the macOS Keychain
security add-generic-password -s zulip-mcp -a you@nearone.org -w
Paste your API key at the prompt (it won't echo). The key is now in your login keychain; it will not appear in any file on disk.
Important: also do the Keychain ACL hardening below. Without it, the entry is silently readable by any process running as your user — no safer than a chmod-600 file.
3. Create .env (no secrets)
cat > .env <<EOF
ZULIP_URL=https://near.zulipchat.com
ZULIP_EMAIL=you@nearone.org
ZULIP_NOTIFICATION_USER=you@nearone.org
EOF
Do not put ZULIP_API_KEY in .env. The start script injects it from
Keychain at launch.
4. Add the start script
Save as start.sh in the repo root:
#!/usr/bin/env bash
set -euo pipefail
cd "$(dirname "$0")"
ZULIP_API_KEY="$(security find-generic-password -s zulip-mcp -w)" \
docker compose up -d "$@"
chmod +x start.sh
5. Start the container
./start.sh
Verify:
curl -sI http://127.0.0.1:3000/sse | head -1 # → HTTP/1.1 200 OK
6. Register with Claude Code
Pick the URL based on where your Claude Code runs:
-
Native Claude Code on macOS:
claude mcp add --transport sse -s user zulip http://127.0.0.1:3000/sse -
Claude Code inside a Docker dev container:
claude mcp add --transport sse -s user zulip http://host.docker.internal:3000/sse
Restart your Claude Code session.
7. Test
In Claude Code:
get my recent Zulip messages
You should see messages come back.
Recommended: block the write tools
VanBarbascu's server registers four write tools (create_drafts, edit_draft,
delete_draft, send_notification). Add this to ~/.claude/settings.json to
stop Claude from calling them:
{
"permissions": {
"allow": [
"mcp__zulip__get_messages",
"mcp__zulip__get_drafts"
],
"deny": [
"mcp__zulip__create_drafts",
"mcp__zulip__edit_draft",
"mcp__zulip__delete_draft",
"mcp__zulip__send_notification"
]
}
}
Required: require confirmation on Keychain access
By default the zulip-mcp Keychain entry is silently readable by any process
running as your user (including Claude Code if you run it natively on macOS).
That makes the Keychain no safer than a chmod-600 file in your home directory —
the TouchID / password prompt below is what actually buys you protection over
storing the token in a file. Skip this and you've spent the Keychain's
ergonomics for none of its security:
- Open Keychain Access — it's tucked away on Sequoia+:
(Or Spotlight → "Keychain Access".)open /System/Library/CoreServices/Applications/Keychain\ Access.app - In the sidebar select login, then the Passwords category, and find
the
zulip-mcpentry. - Right-click → Get Info → Access Control tab.
- Choose Confirm before allowing access.
- Under Always allow access by these applications, select
securityand click − to remove it. (When you created the entry withsecurity add-generic-password, thesecuritybinary was auto-added to the trusted list — apps in that list bypass the confirmation prompt, so the checkbox alone isn't enough.) - Save Changes.
Trade-off: you'll get a prompt every time ./start.sh runs. That's the point —
so will any other process that tries to read the key.
Daily use
The container has restart: unless-stopped, so it comes back on reboots.
Manual controls:
./start.sh # bring up
./start.sh --build # rebuild after code/Dockerfile changes
docker compose down # stop
docker compose logs -f zulip-mcp
Troubleshooting
"Malformed API key" — the value in the container is wrong. Check length (should be 32):
docker compose exec zulip-mcp sh -c 'printf "len=%s\n" "${#ZULIP_API_KEY}"'
If it's not 32, redo step 2 — the Keychain entry probably has extra whitespace or the wrong value.
MCP won't connect in Claude Code — check you used the right URL for your Claude Code environment (step 6). Verify reachability:
# native local host
curl -sI http://127.0.0.1:3000/sse
# or from inside a dev container:
curl -sI http://host.docker.internal:3000/sse
Tools not visible in Claude Code — restart the session after claude mcp add.
Confirm with claude mcp list.
Security notes
What this setup protects against
- API key is not in
~/.claude.jsonor any other Claude-visible config. - Claude Code running in a dev container cannot reach the key via its tools:
no
securitybinary to hit the Keychain, network-only access to the MCP container (no filesystem / process / env sharing). - Port bound to
127.0.0.1:3000— not exposed on your network.
What it does not protect against
- Anyone with Docker daemon access (you, or any process on your Mac with
dockeronPATH) can read the key:docker compose exec zulip-mcp env | grep ZULIP_API_KEY - Claude Code running natively on macOS falls in that category — its Bash
tool can call
docker execorsecurity find-generic-passwordjust like you can. The companion-container isolation only bites when Claude itself runs in a separate container without Docker socket access. - Memory inspection of the running MCP process (via a debugger) would also
expose the key. Same for any
docker inspectof the container.
Practical mitigations
- Use a dedicated bot key so rotation is cheap and blast radius is bounded to streams the bot is subscribed to.
- Keep the write-tool allowlist above to prevent accidental sends.
- Lock down the Keychain entry with Confirm before allowing access (see
required section above). Without it the Keychain adds nothing over a file,
since any user-owned process can read it silently. The trade-off is a
TouchID/password prompt on every
./start.sh.